
- Title
-
Cited4a limits cardiomyocyte dedifferentiation and proliferation during zebrafish heart regeneration
- Authors
- Forman-Rubinsky, R., Paul, A., Feng, W., Schlegel, B.T., Zuppo, D.A., Kedziora, K., Stoltz, D.B., Watkins, S.C., Rajasundaram, D., Li, G., Tsang, M.
- Source
- Full text @ Development
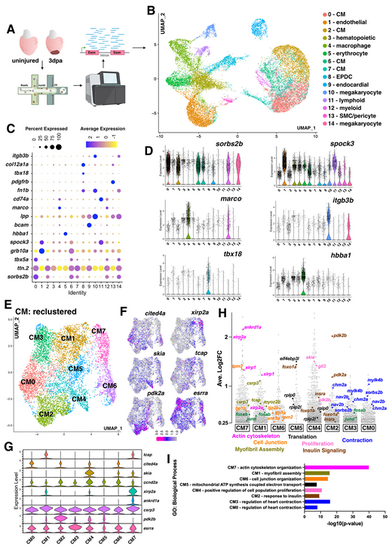
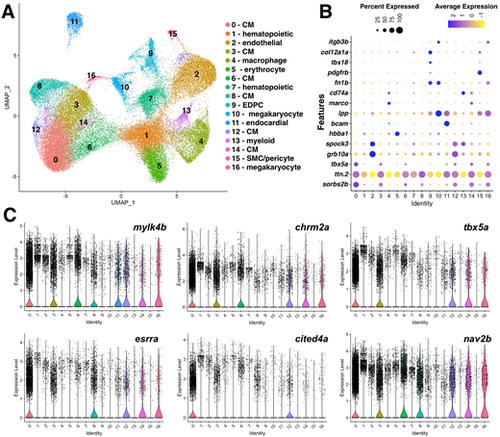
snRNA-seq of the regenerating adult zebrafish heart identifies eight dynamic CM populations. (A) Overview of snRNA-seq of zebrafish heart regeneration experiment. Created in BioRender by Tsang, M. (2025). https://BioRender.com/t1a2g67. This figure was sublicensed under CC-BY 4.0 terms. (B) UMAP visualization of nuclei from snRNA-seq of uninjured and 3 dpa hearts. Clusters are color coded with cell annotation. (C) Dot plot showing differentially expressed marker genes per cluster 0-14. (D) Violin plots showing expression levels of key cell type markers. (E) UMAP visualization of second level reclustered CMs colored by cluster. (F) Feature plots visualizing distinct gene expression in CM clusters. (G) Violin plots showing expression levels of key markers across CM clusters. (H) Gene expression plot by average log2 fold change in each cluster. Each dot represents a single gene. Genes with functions related to actin cytoskeleton organization (fuchsia), cell junction rearrangement (orange), myofibril assembly (olive green), translation (black), proliferation (light pink), insulin signaling (brown) and contraction (blue) are shown. (I) Plot of top GO terms enriched for each cluster identified via the ToppFUN bioinformatic tool. |
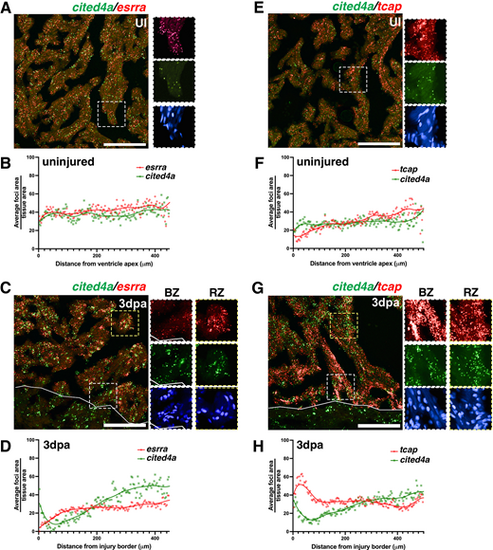
cited4a, esrra and tcap expression in distinct CM populations in regeneration. (A-D) Representative image of cited4a (green) and esrra (red) transcripts detected by RNAscope and quantification of signal foci/tissue area in relation to distance from the border zone in an uninjured (UI) (A,B) and injured (3 dpa) (C,D) ventricle. (E-H) Representative image of cited4a (green) and tcap (red) transcripts detected by RNAscope and quantification of signal foci/tissue area in relation to distance from the border zone in an uninjured (E,F) and in 3 dpa (G,H) ventricle. Signal/tissue area is normalized 0 to 100. Trend line shows the average from n=4 hearts per condition. Magnification of dashed boxed areas to right show individual channels in regions close to the border zone (BZ, white box) or remote zone (RZ, yellow box). Scale bars: 100 µm. |
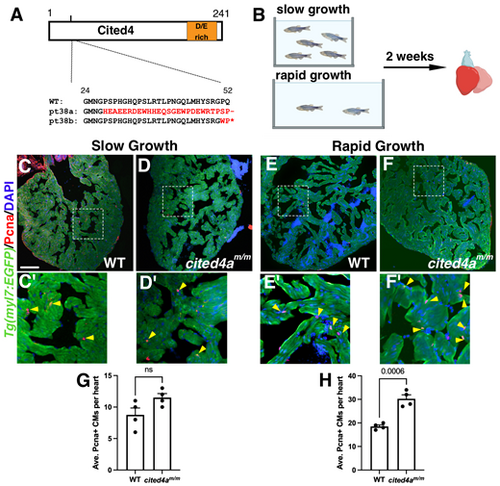
Increased CM proliferation is observed in cited4am/m under rapid growth conditions. (A) Schematic of Cited4a protein with glutamic and aspartic acid (D/E)-rich domain and predicted amino acid sequence of cited4a alleles. Altered sequence in red. (B) Schematic of slow versus rapid growth experiment in juvenile zebrafish. Created in BioRender by Tsang, M. (2025). https://BioRender.com/0lu862o. This figure was sublicensed under CC-BY 4.0 terms. (C-F′) Pcna immunostaining (red) of Tg(myl7:EGF) (WT) and mutant [Tg(myl7:EGFP);cited4am/m] hearts from slow and rapid growth conditions to mark proliferating cells. Magnification of dashed boxed areas below show regions of the ventricle with proliferating CMs. Arrowheads indicate PCNA-positive CMs. (G) Graph of average Pcna+ CMs per heart (n=4 for each condition) from slow growth. (H) Graph of Pcna+ CMs from rapid growth. Data are mean±s.e.m. Unpaired two-tailed t-test. ns, not significant. Scale bar: 100 µm. |
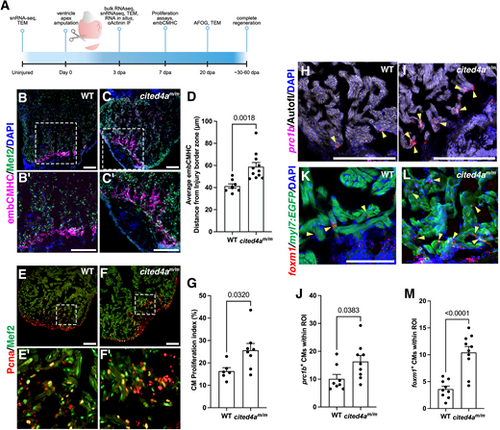
Cited4a limits CM dedifferentiation and proliferation in heart regeneration. (A) Timeline of injury and experiments. dpa, days post amputation. Created in BioRender by Forman-Rubinksy, R. (2025) https://BioRender.com/ifbq3md. This figure was sublicensed under CC-BY 4.0 terms. (B-C′) Immunostaining of embCMHC (magenta) to mark dedifferentiating CMs and Mef2a/c (green) to mark CMs, with DAPI (blue), in 3 dpa WT (B,B′) and cited4am/m (C,C′) ventricles. (D) Graph showing average distance of embCMHC staining from injury border zone in WT and cited4am/m hearts. WT n=8; cited4am/m n=11. (E-F′) Immunostaining of Pcna (red) to mark proliferating CMs and Mef2 (green) to mark CMs in 3 dpa WT (E,E′) and cited4am/m (F,F′) ventricles. (G) Quantification of CM proliferation index (Pcna+;Mef2+/Total Mef2c+). WT n=6; cited4am/m n=8. (H,I) prc1b (red) transcripts detected at the injury border zone by RNAscope with DAPI and autofluorescent myocardial tissue in 3 dpa WT (H) and cited4am/m (I) ventricles. (J) Quantification of proliferating prc1b+ nuclei in the myocardium. WT n=8; cited4am/m n=9. (K,L) foxm1 (red) transcripts detected at the injury border zone by RNAscope with myl7:EGFP to mark CMs, and DAPI, in 3 dpa WT (K) and cited4am/m (L) ventricles. Arrowheads highlight examples of proliferating CM in image. (M) Quantification of foxm1+ CMs at the injury border zone. WT n=9; cited4am/m n=10. Data are mean±s.e.m. Unpaired two-tailed t-test. Scale bars: 100 µm. |
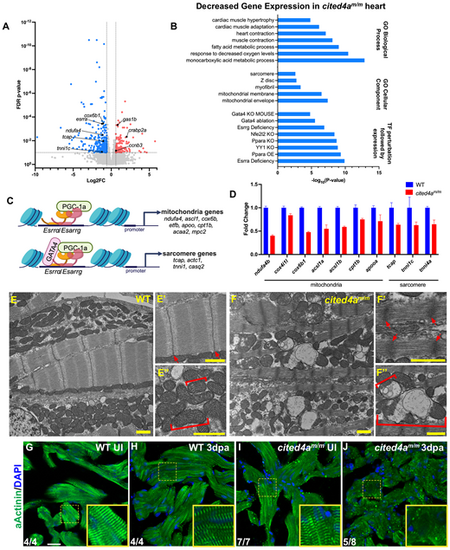
cited4a-deficient hearts show altered mitochondrial and sarcomere structures during regeneration. (A) Volcano plot of RNA-seq from cited4am/m ventricles at 3 dpa versus WT. Significantly decreased transcripts (blue), significantly increased transcripts (red), transcripts with no significant change (gray). (B) Biological process GO-terms, cellular component GO-terms and transcription factor (TF) perturbation-associated gene expression signatures with significant overlap associated with significantly decreased genes in cited4am/m heart at 3 dpa versus WT. (C) Esrrα/Esrrγ regulate CM maturation via induction of mitochondria and sarcomere gene expression. Created in BioRender by Forman-Rubinksy, R. (2025). https://BioRender.com/z08oupu. This figure was sublicensed under CC-BY 4.0 terms. (D) Representative qPCR validation of decreased mitochondria and sarcomere genes from bulk RNA-seq. Error bars represent standard deviation of technical replicates. Experiment was performed three times, showing consistent trends. (E-E″) TEM of a WT 3dpa ventricle showing clear intact sarcomere structures (M-band, A-band, I-band and z-disc) and mitochondria with densely packed cristae. (F-F″) TEM image of a cited4am/m mutant 3 dpa heart showing a thick z-disk and dysmorphic mitochondria with fragmented cristae. Arrows indicate sarcomere z-disc. Bracket indicates a single mitochondrion. (G-J) Immunostaining of α-Actinin to mark sarcomere z-disk and DAPI in uninjured (UI) WT (n=4) (G), injured (3 dpa) WT (n=4) (H), UI cited4am/m (n=7) (I) and injured (3 dpa) cited4am/m (n=8) (J) ventricles. Yellow scale bar:1 µm. White scale bar: 20 µm. |
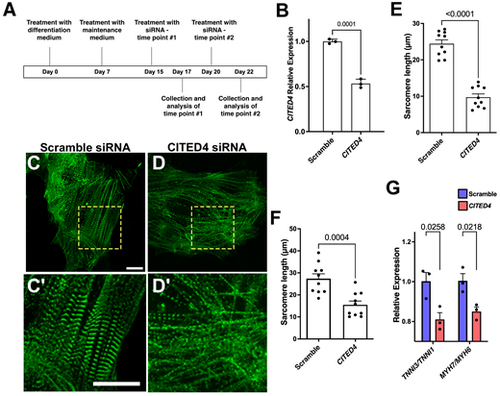
CITED4 is required for hiPSC-derived CM maturation. (A) Experimental timeline. (B) qPCR analysis for CITED4 expression in hiPSC-CMs following treatment with CITED4 siRNA or scramble control siRNA. (C-D′) ACTN2-eGFP hiPSC-CMs following treatment with scramble control (C,C′) or CITED4 (D,D′). Magnification of dashed boxed areas below show sarcomere structure based on ACTN2-GFP expression. (E,F) Quantification of sarcomere length in hiPSC-CMs at day 17 (E) and day 22 (F) following treatment with CITED4 siRNA or scramble control siRNA. (G) Gene expression ratios between TNNI3/TNNI1 and MYH7/MYH6 measured by qPCR in hiPSC-CMs following treatment with CITED4 siRNA or scramble control siRNA. Data are mean±s.e.m. Unpaired two-tailed t-test. Scale bars: 20 µm. |
snRNA-seq of cited4a-deficient hearts reveals increased heterogeneity in CM clusters. (A) UMAP visualization of sequenced nuclei from all conditions (WT UI, WT 3 dpa, cited4am/m UI, cited4am/m 3 dpa) colored by cluster and labeled with cell type. (B) Dot plot showing differentially expressed marker genes per cluster. (C) Violin plots of CM genes to highlight these populations after integration and revealing six CM clusters with the integration of cited4am/m hearts compared to four from WT only. |
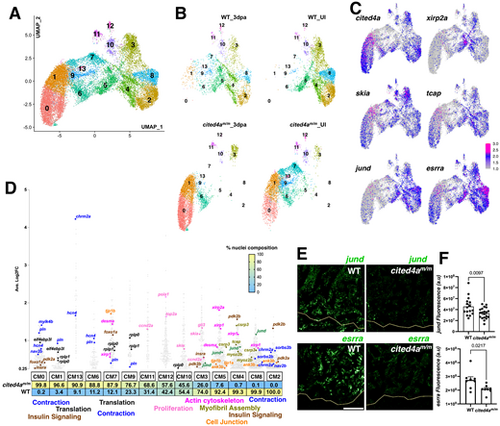
Second level reclustering and integration of CMs in cited4m/m and WT hearts show distinct CM populations that are not shared. (A,B) UMAP visualization of reclustered CM (A) and split into each condition and genotype (B). (C) Feature plot of gene expression in the CM clusters. (D) Gene expression plot by average log2 fold change in each CM cluster. Each dot represents a single gene, with percentage of nuclei composition for each genotype listed below. (E,F) Representative images of jund and esrra transcripts detected by RNAscope accompanied with graphs showing fluorescent intensity measurements in WT and cited4am/m ventricles at 3 dpa. Data are mean±s.e.m. Unpaired two-tailed t-test. Yellow line in E indicates amputation plane. Fluorescent intensity of RNAscope in F in arbitrary units (a.u.). For jund WT n=4; cited4am/m n=5. For esrra n=4 for each condition. Each dot represents measurements from a single 14 µm section. Four sections per heart for jund, two sections per heart for esrra. Scale bar: 100 µm. |