
|
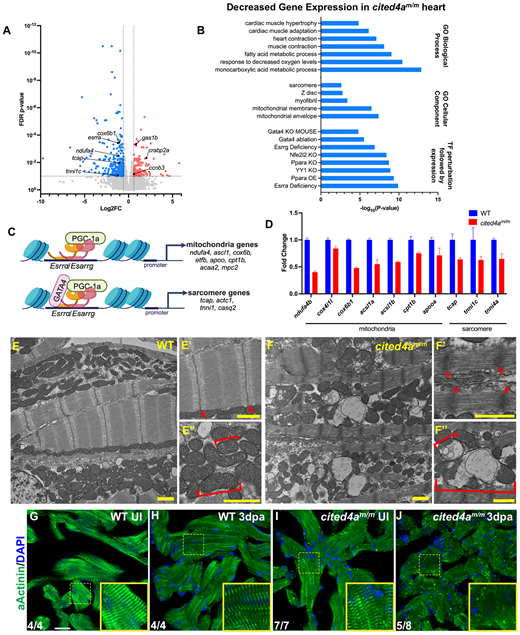
Fig. 5 cited4a-deficient hearts show altered mitochondrial and sarcomere structures during regeneration. (A) Volcano plot of RNA-seq from cited4am/m ventricles at 3 dpa versus WT. Significantly decreased transcripts (blue), significantly increased transcripts (red), transcripts with no significant change (gray). (B) Biological process GO-terms, cellular component GO-terms and transcription factor (TF) perturbation-associated gene expression signatures with significant overlap associated with significantly decreased genes in cited4am/m heart at 3 dpa versus WT. (C) Esrrα/Esrrγ regulate CM maturation via induction of mitochondria and sarcomere gene expression. Created in BioRender by Forman-Rubinksy, R. (2025). https://BioRender.com/z08oupu. This figure was sublicensed under CC-BY 4.0 terms. (D) Representative qPCR validation of decreased mitochondria and sarcomere genes from bulk RNA-seq. Error bars represent standard deviation of technical replicates. Experiment was performed three times, showing consistent trends. (E-E″) TEM of a WT 3dpa ventricle showing clear intact sarcomere structures (M-band, A-band, I-band and z-disc) and mitochondria with densely packed cristae. (F-F″) TEM image of a cited4am/m mutant 3 dpa heart showing a thick z-disk and dysmorphic mitochondria with fragmented cristae. Arrows indicate sarcomere z-disc. Bracket indicates a single mitochondrion. (G-J) Immunostaining of α-Actinin to mark sarcomere z-disk and DAPI in uninjured (UI) WT (n=4) (G), injured (3 dpa) WT (n=4) (H), UI cited4am/m (n=7) (I) and injured (3 dpa) cited4am/m (n=8) (J) ventricles. Yellow scale bar:1 µm. White scale bar: 20 µm.