
|
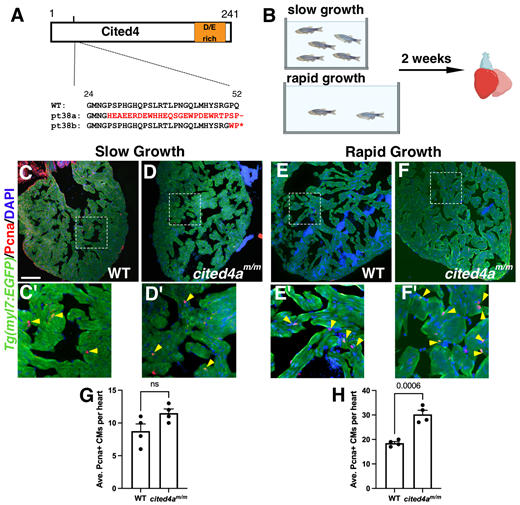
Fig. 3 Increased CM proliferation is observed in cited4am/m under rapid growth conditions. (A) Schematic of Cited4a protein with glutamic and aspartic acid (D/E)-rich domain and predicted amino acid sequence of cited4a alleles. Altered sequence in red. (B) Schematic of slow versus rapid growth experiment in juvenile zebrafish. Created in BioRender by Tsang, M. (2025). https://BioRender.com/0lu862o. This figure was sublicensed under CC-BY 4.0 terms. (C-F′) Pcna immunostaining (red) of Tg(myl7:EGF) (WT) and mutant [Tg(myl7:EGFP);cited4am/m] hearts from slow and rapid growth conditions to mark proliferating cells. Magnification of dashed boxed areas below show regions of the ventricle with proliferating CMs. Arrowheads indicate PCNA-positive CMs. (G) Graph of average Pcna+ CMs per heart (n=4 for each condition) from slow growth. (H) Graph of Pcna+ CMs from rapid growth. Data are mean±s.e.m. Unpaired two-tailed t-test. ns, not significant. Scale bar: 100 µm.