
Image
|
Figure Caption
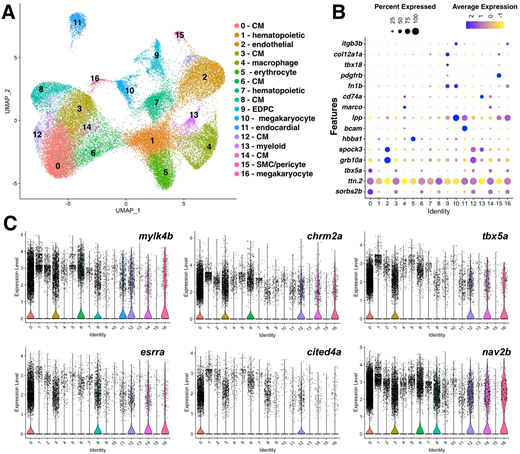
Fig. 7 snRNA-seq of cited4a-deficient hearts reveals increased heterogeneity in CM clusters. (A) UMAP visualization of sequenced nuclei from all conditions (WT UI, WT 3 dpa, cited4am/m UI, cited4am/m 3 dpa) colored by cluster and labeled with cell type. (B) Dot plot showing differentially expressed marker genes per cluster. (C) Violin plots of CM genes to highlight these populations after integration and revealing six CM clusters with the integration of cited4am/m hearts compared to four from WT only.
Acknowledgments
This image is the copyrighted work of the attributed author or publisher, and
ZFIN has permission only to display this image to its users.
Additional permissions should be obtained from the applicable author or publisher of the image.
Full text @ Development