
|
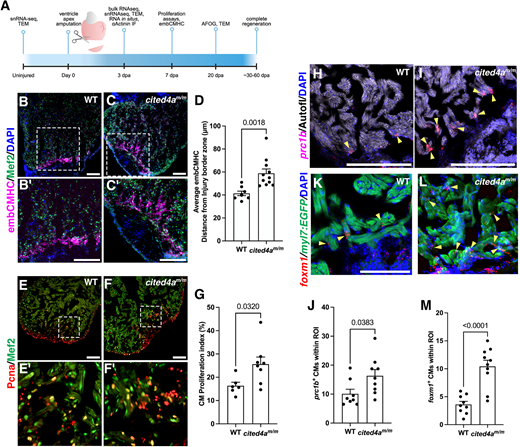
Fig. 4 Cited4a limits CM dedifferentiation and proliferation in heart regeneration. (A) Timeline of injury and experiments. dpa, days post amputation. Created in BioRender by Forman-Rubinksy, R. (2025) https://BioRender.com/ifbq3md. This figure was sublicensed under CC-BY 4.0 terms. (B-C′) Immunostaining of embCMHC (magenta) to mark dedifferentiating CMs and Mef2a/c (green) to mark CMs, with DAPI (blue), in 3 dpa WT (B,B′) and cited4am/m (C,C′) ventricles. (D) Graph showing average distance of embCMHC staining from injury border zone in WT and cited4am/m hearts. WT n=8; cited4am/m n=11. (E-F′) Immunostaining of Pcna (red) to mark proliferating CMs and Mef2 (green) to mark CMs in 3 dpa WT (E,E′) and cited4am/m (F,F′) ventricles. (G) Quantification of CM proliferation index (Pcna+;Mef2+/Total Mef2c+). WT n=6; cited4am/m n=8. (H,I) prc1b (red) transcripts detected at the injury border zone by RNAscope with DAPI and autofluorescent myocardial tissue in 3 dpa WT (H) and cited4am/m (I) ventricles. (J) Quantification of proliferating prc1b+ nuclei in the myocardium. WT n=8; cited4am/m n=9. (K,L) foxm1 (red) transcripts detected at the injury border zone by RNAscope with myl7:EGFP to mark CMs, and DAPI, in 3 dpa WT (K) and cited4am/m (L) ventricles. Arrowheads highlight examples of proliferating CM in image. (M) Quantification of foxm1+ CMs at the injury border zone. WT n=9; cited4am/m n=10. Data are mean±s.e.m. Unpaired two-tailed t-test. Scale bars: 100 µm.