
|
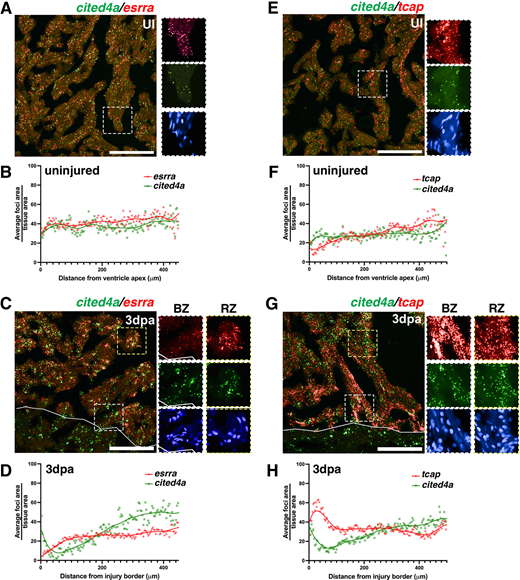
Fig. 2 cited4a, esrra and tcap expression in distinct CM populations in regeneration. (A-D) Representative image of cited4a (green) and esrra (red) transcripts detected by RNAscope and quantification of signal foci/tissue area in relation to distance from the border zone in an uninjured (UI) (A,B) and injured (3 dpa) (C,D) ventricle. (E-H) Representative image of cited4a (green) and tcap (red) transcripts detected by RNAscope and quantification of signal foci/tissue area in relation to distance from the border zone in an uninjured (E,F) and in 3 dpa (G,H) ventricle. Signal/tissue area is normalized 0 to 100. Trend line shows the average from n=4 hearts per condition. Magnification of dashed boxed areas to right show individual channels in regions close to the border zone (BZ, white box) or remote zone (RZ, yellow box). Scale bars: 100 µm.