
Fig. 8
- ID
- ZDB-FIG-250905-39
- Publication
- Forman-Rubinsky et al., 2025 - Cited4a limits cardiomyocyte dedifferentiation and proliferation during zebrafish heart regeneration
- Other Figures
- All Figure Page
- Back to All Figure Page
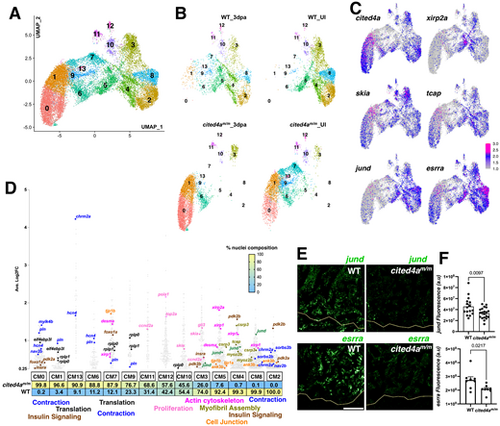
Second level reclustering and integration of CMs in cited4m/m and WT hearts show distinct CM populations that are not shared. (A,B) UMAP visualization of reclustered CM (A) and split into each condition and genotype (B). (C) Feature plot of gene expression in the CM clusters. (D) Gene expression plot by average log2 fold change in each CM cluster. Each dot represents a single gene, with percentage of nuclei composition for each genotype listed below. (E,F) Representative images of jund and esrra transcripts detected by RNAscope accompanied with graphs showing fluorescent intensity measurements in WT and cited4am/m ventricles at 3 dpa. Data are mean±s.e.m. Unpaired two-tailed t-test. Yellow line in E indicates amputation plane. Fluorescent intensity of RNAscope in F in arbitrary units (a.u.). For jund WT n=4; cited4am/m n=5. For esrra n=4 for each condition. Each dot represents measurements from a single 14 µm section. Four sections per heart for jund, two sections per heart for esrra. Scale bar: 100 µm. |