
|
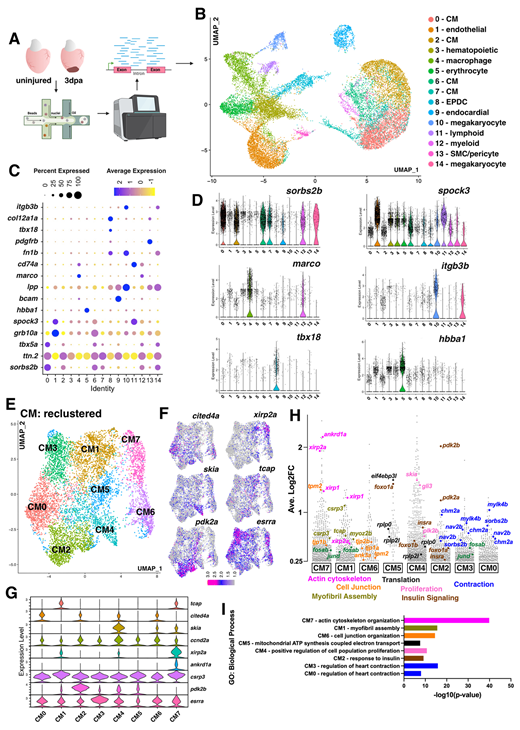
Fig. 1 snRNA-seq of the regenerating adult zebrafish heart identifies eight dynamic CM populations. (A) Overview of snRNA-seq of zebrafish heart regeneration experiment. Created in BioRender by Tsang, M. (2025). https://BioRender.com/t1a2g67. This figure was sublicensed under CC-BY 4.0 terms. (B) UMAP visualization of nuclei from snRNA-seq of uninjured and 3 dpa hearts. Clusters are color coded with cell annotation. (C) Dot plot showing differentially expressed marker genes per cluster 0-14. (D) Violin plots showing expression levels of key cell type markers. (E) UMAP visualization of second level reclustered CMs colored by cluster. (F) Feature plots visualizing distinct gene expression in CM clusters. (G) Violin plots showing expression levels of key markers across CM clusters. (H) Gene expression plot by average log2 fold change in each cluster. Each dot represents a single gene. Genes with functions related to actin cytoskeleton organization (fuchsia), cell junction rearrangement (orange), myofibril assembly (olive green), translation (black), proliferation (light pink), insulin signaling (brown) and contraction (blue) are shown. (I) Plot of top GO terms enriched for each cluster identified via the ToppFUN bioinformatic tool.