
- Title
-
C-mannosyltransferase DPY19L1L-mediated Reissner Fiber formation is critical for zebrafish (Danio rerio) body axis straightening
- Authors
- Tian, G., Huang, L., Xu, Z., Lu, C., Yuan, W., Wu, Y., Liao, Z., Gao, J., Luo, Q., Cheng, B., Liao, X., Lu, H.
- Source
- Full text @ Sci Adv
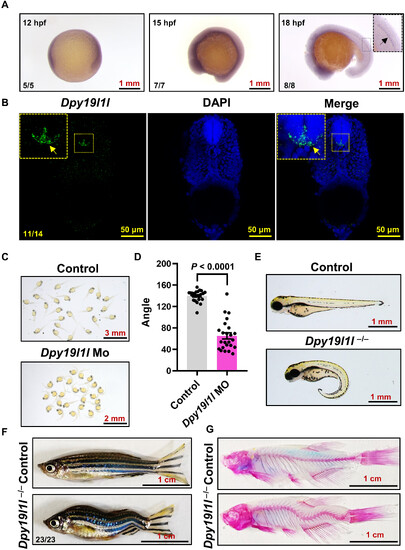
Dpy19l1l expression in the spinal cord and its mutation leading to IS-like body axis curvature. (A) WMISH of dpy19l1l at 12 to 18 hpf. The arrow in the enlarged view of 18 hpf larvae indicates dpy19l1l expression. (B) Confocal projection of longitudinal trunk sections from 36 hpf larvae hybridized with a fluorescence riboprobe and 4′,6-diamidino-2-phenylindole (DAPI). The yellow arrow in the enlarged view marks dpy19l1l expression in spinal cord floor plate cells. (C) Phenotypes of dpy19l1l MO-injected larvae at 36 hpf, showing body axis curvature. (D) Quantification of body axis angles using ImageJ (bar graph; means ± SEM, n = 24). The P value (unpaired t test) is indicated above bars. (E) External phenotypes of control sibling and dpy19l1l−/− mutants at 2 dpf. (F) External phenotypes of adult control sibling and dpy19l1l−/− mutants. (G) ARS staining of adult control sibling and dpy19l1l−/− mutants. |
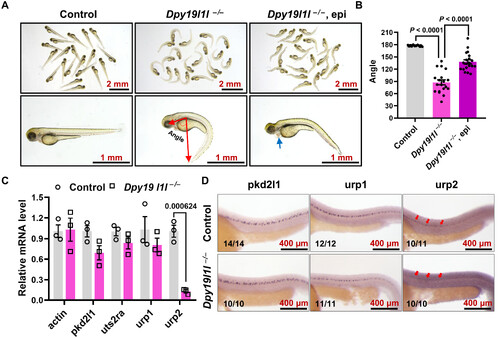
Urp2 transcription is substantial reduced in dpy19l1l mutants. (A) External phenotypes of control siblings, dpy19l1l−/− mutants, and epinephrine-treated dpy19l1l−/− mutants at 48 hpf. The schematic angle illustrates the quantification method in this study. The blue arrow indicates pericardial edema in epinephrine-treated mutants. (B) Body axis angles from (A) quantified with ImageJ (bar graph; means ± SEM). P values (unpaired t test) are shown above bars. (C) qPCR analysis of pkd2l1, uts2ra, urp1, and urp2 expression in control siblings and dpy19l1l−/− mutants at 36 hpf (means ± SEM, n = 3; number above the bar graph represent the P value). (D) WMISH of pkd2l1, urp1, and urp2 in control siblings and dpy19l1l−/− mutants at 36 hpf. The red arrows highlight diminished urp2 expression. |
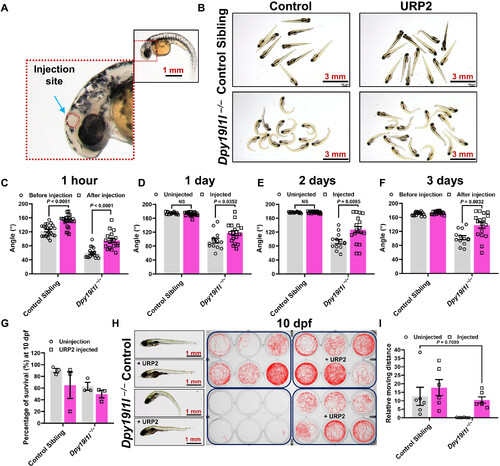
URP2 injection rescues spinal curvature in dpy19l1l−/− mutants. (A) Schematic of URP2 injection site (cerebral ventricle marked by the blue arrow). (B) External phenotypes of control siblings and URP2-injected dpy19l1l−/− mutants at 3 days postinjection. (C to F) Body axis angles of URP2 injection experiment zebrafish at indicated time points, quantified with ImageJ (bar graphs; means ± SEM; P values above bars, unpaired t test). (G) Survival rate of URP2 injection experiment zebrafish at 10 dpf (means ± SEM). (H) External phenotypes (left) and swim trajectories (right) of URP2 injection experiment zebrafish at 10 dpf. (I) Quantification of swimming distance in (H) (means ± SEM, n = 6; P value above bar). |
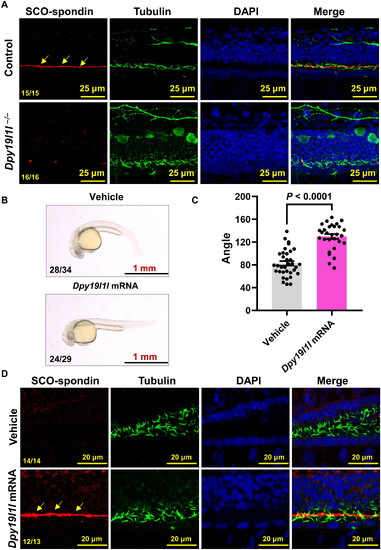
Dpy19l1l−/− mutants lack RF. (A) Confocal images showing the location of RF by immunostaining with SCO-spondin antibody (red) and cilia antibody (green) in control siblings and dpy19l1l−/− mutants at 36 hpf. Nuclei counterstained with DAPI. Yellow arrows indicate intact RF in controls. (B) External phenotypes of dpy19l1l−/− mutants injected with vehicle or dpy19l1l mRNA at 36 hpf. (C) Body axis angles of mutants in (B) quantified with ImageJ (means ± SEM; P values above bars, unpaired t test). (D) Confocal images of the reestablished RF (red) in dpy19l1l mRNA-rescued mutants at 36 hpf. Yellow arrows mark reestablished RF. |
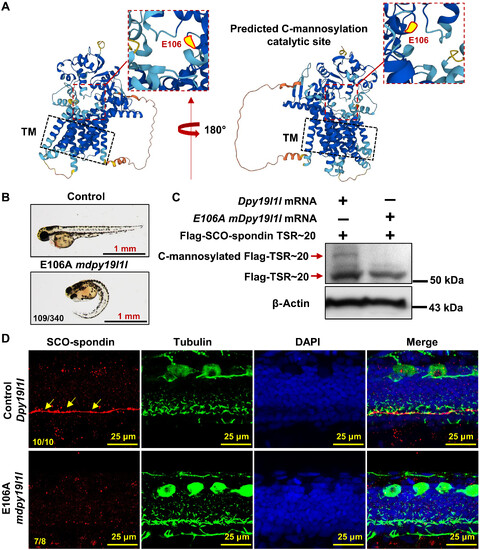
DPY19L1L C-mannosylates SCO-spondin TSR motifs. (A) AlphaFold-predicted DPY19L1L structure. Red box highlights the catalytic core; yellow dot marks putative C-mannosylation site (E106). TM, transmembrane region. (B) Phenotypes of wild-type embryos injected with E106A dpy19l1l mRNA at 48 hpf. (C) Immunoblot of Flag-TSR~20 lysates from injected embryos. Anti-Flag detects Flag-TSR~20 and C-mannosylated Flag-TSR~20. (D) RF localization (red) in wild-type embryos injected with control or E106A dpy19l1l mRNA (36 hpf). Red: SCO-spondin; green: cilia; DAPI: nuclei. Yellow arrows indicate RF in controls. |
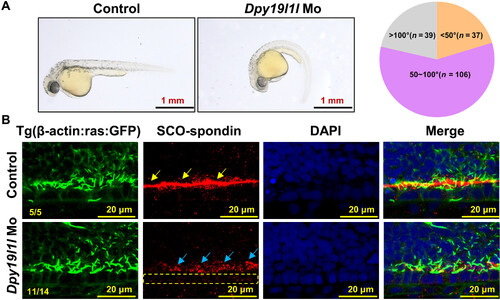
SCO-spondin secretion persists in dpy19l1l morphants. (A) External phenotypes of Tg(β-actin:ras:GFP) embryos injected with dpy19l1l morpholino at 36 hpf. Pie chart: body axis angles. (B) RF and SCO-spondin localization in controls and dpy19l1l MO embryos (36 hpf). Red: SCO-spondin; green: membrane and cilia; DAPI: nuclei. Yellow arrows: intact RF; blue arrows: SCO-spondin; yellow dashed box: floor plate cells |
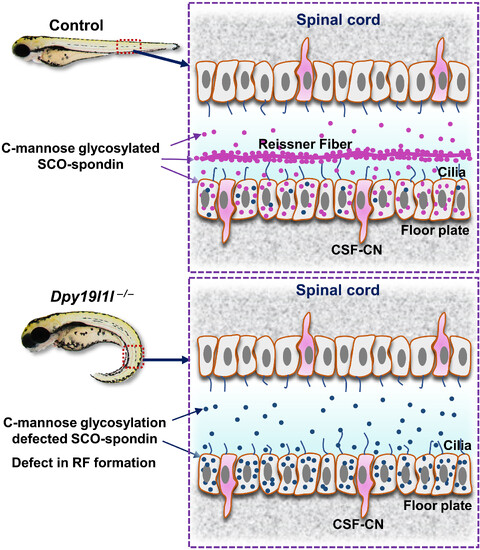
Model of SCO-spondin and RF in control and dpy19l1l-deficient zebrafish. (Top) In wild-type spinal cord, DPY19L1L C-mannosylates SCO-spondin (purple), enabling RF formation via cilia-driven CSF flow. (Bottom) In dpy19l1l−/− mutants, nonglycosylated SCO-spondin (dark blue) fails to form RF, leading to body axis curvature. CSF-CN, CSF-contacting neuron. |