
Fig. 2
- ID
- ZDB-IMAGE-250602-22
- Genes
- Publication
- Tian et al., 2025 - C-mannosyltransferase DPY19L1L-mediated Reissner Fiber formation is critical for zebrafish (Danio rerio) body axis straightening
- All Figures
- Figures for Tian et al., 2025
|
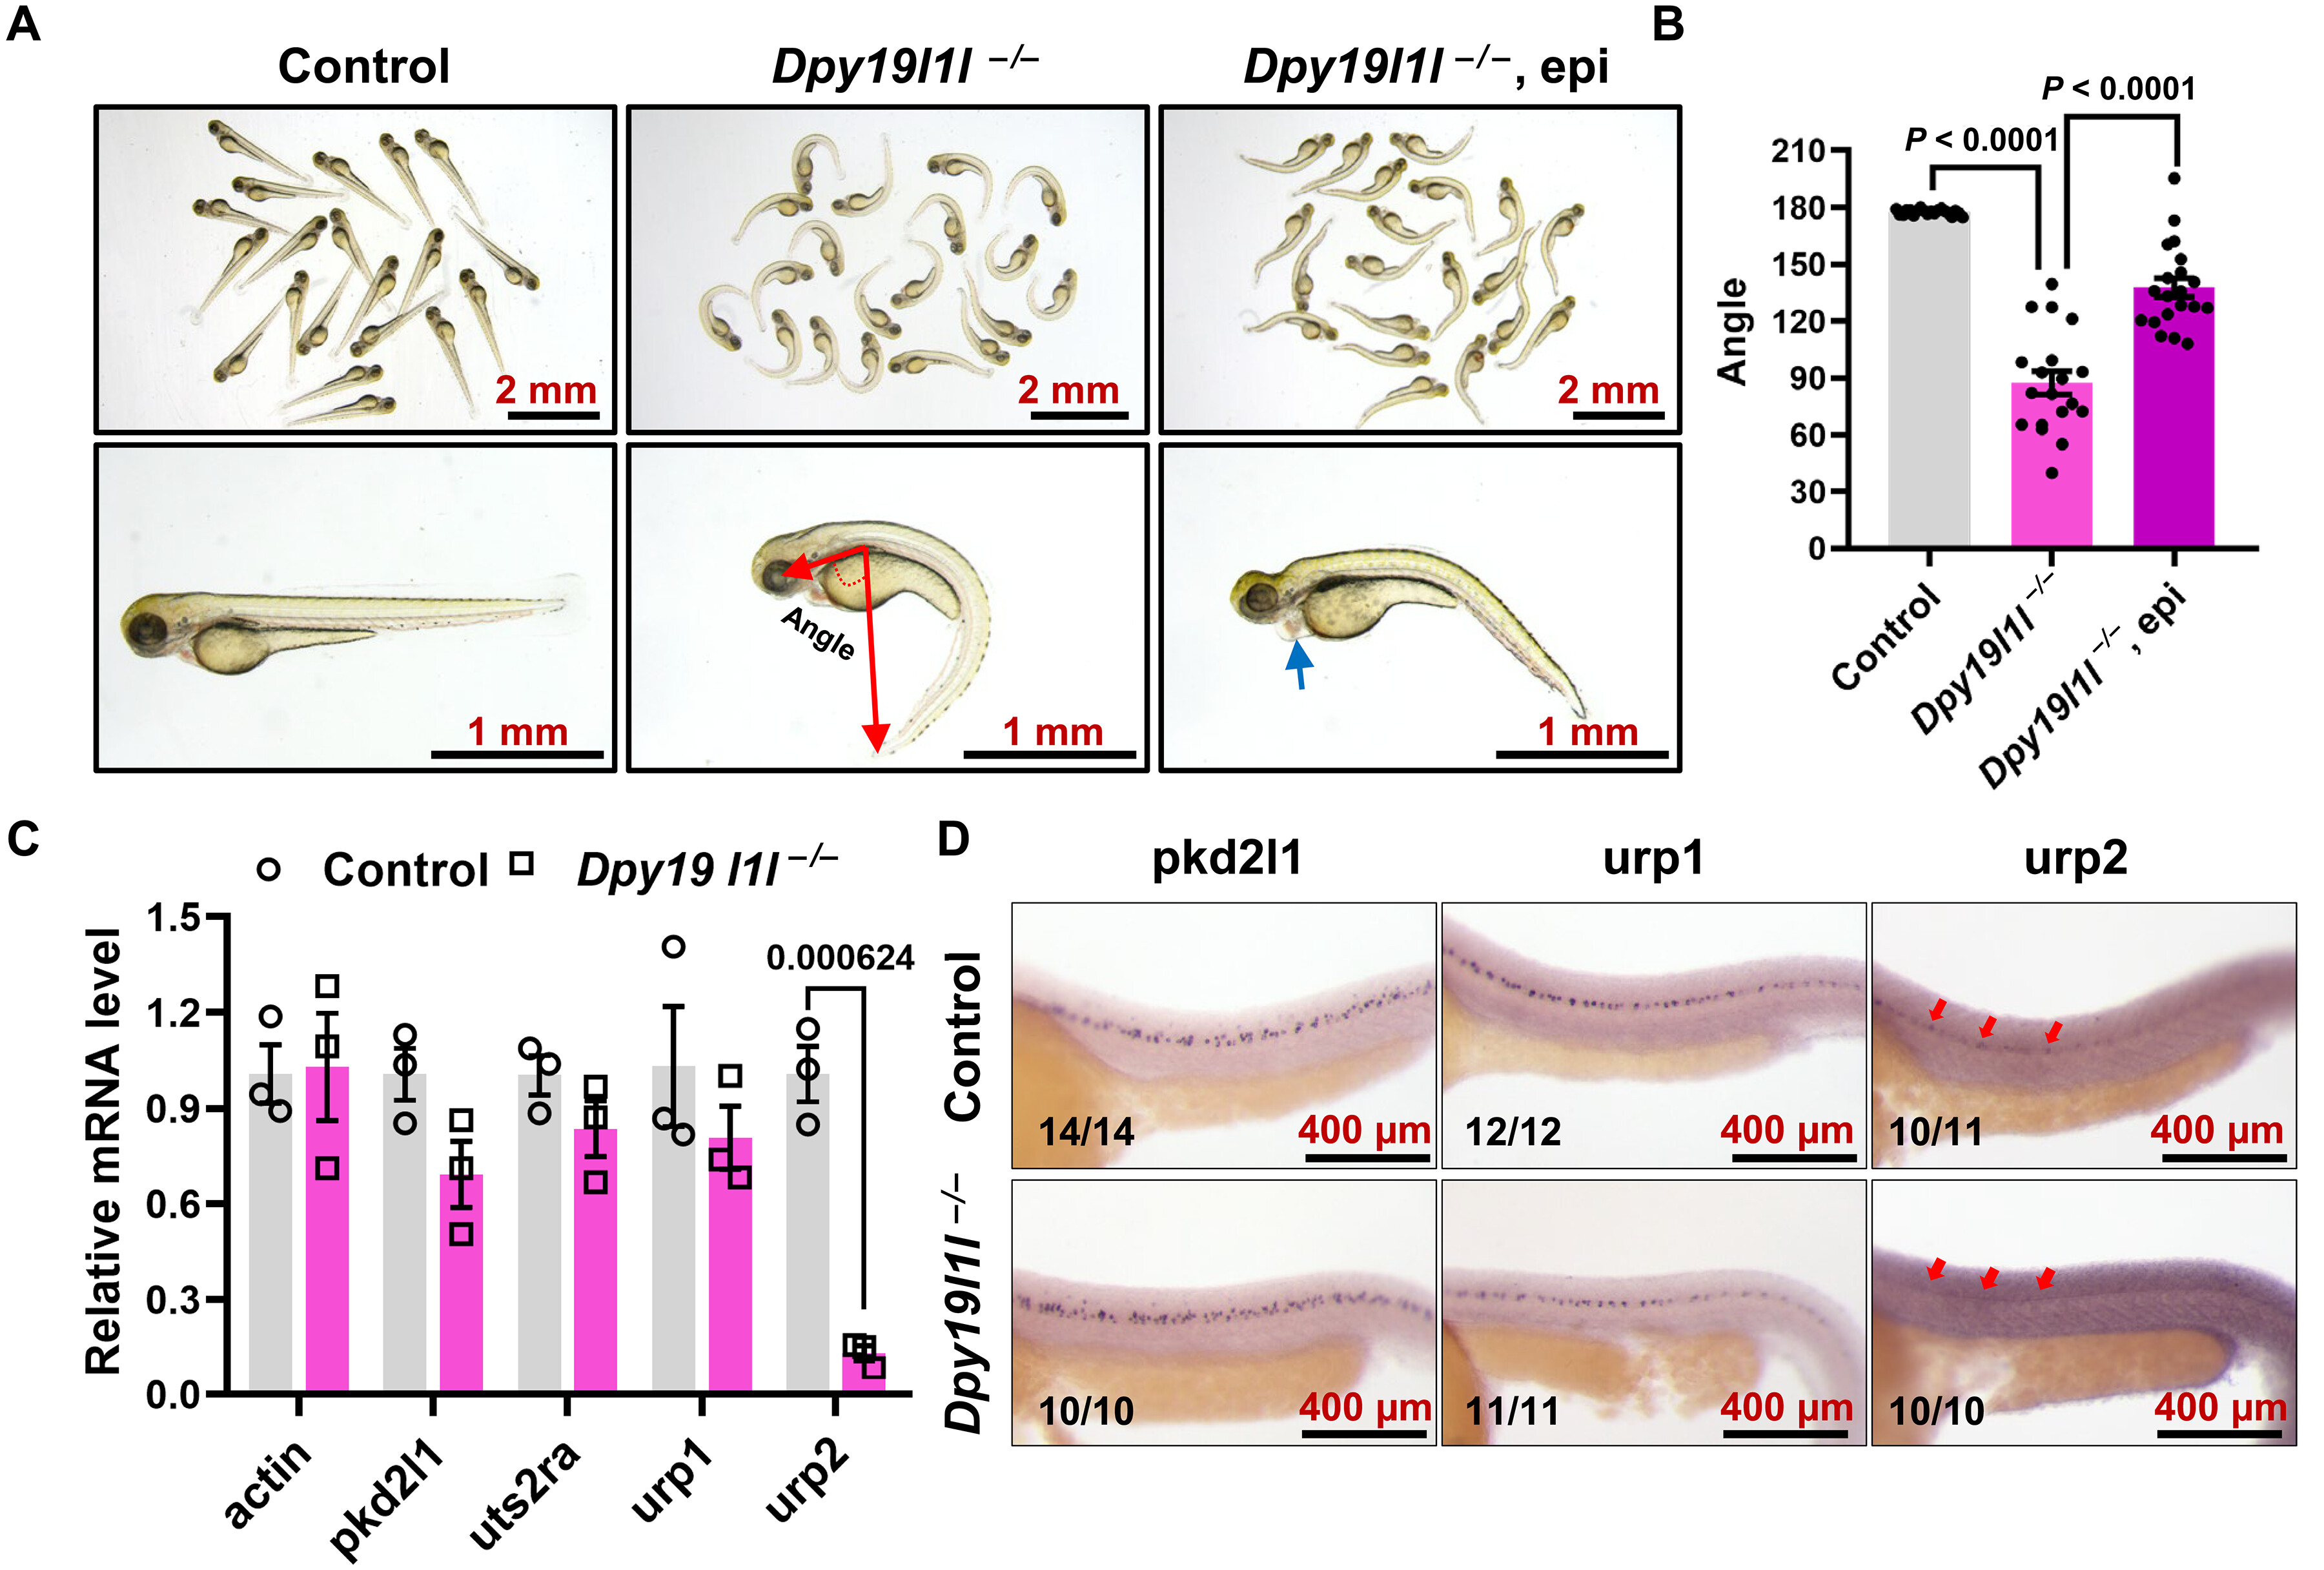
Fig. 2 Urp2 transcription is substantial reduced in dpy19l1l mutants. (A) External phenotypes of control siblings, dpy19l1l−/− mutants, and epinephrine-treated dpy19l1l−/− mutants at 48 hpf. The schematic angle illustrates the quantification method in this study. The blue arrow indicates pericardial edema in epinephrine-treated mutants. (B) Body axis angles from (A) quantified with ImageJ (bar graph; means ± SEM). P values (unpaired t test) are shown above bars. (C) qPCR analysis of pkd2l1, uts2ra, urp1, and urp2 expression in control siblings and dpy19l1l−/− mutants at 36 hpf (means ± SEM, n = 3; number above the bar graph represent the P value). (D) WMISH of pkd2l1, urp1, and urp2 in control siblings and dpy19l1l−/− mutants at 36 hpf. The red arrows highlight diminished urp2 expression.