FIGURE SUMMARY
Title

Identification of Key Active Constituents in Eucommia ulmoides Oliv. Leaves Against Parkinson's Disease and the Alleviative Effects via 4E-BP1 Up-Regulation

Authors
Li, Y., Shi, R., Xia, L., Zhang, X., Zhang, P., Liu, S., Liu, K., Sik, A., Stoika, R., Jin, M.
Source
Full text @ Int. J. Mol. Sci.

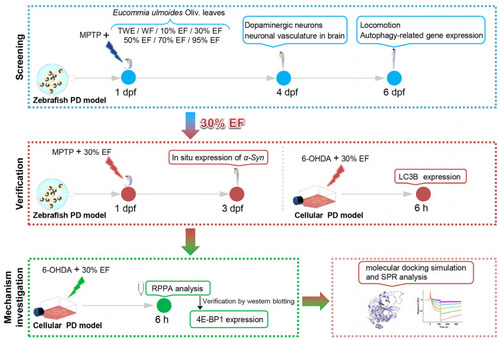
The experimental workflow chart. Zebrafish at 1 day (s) post fertilization (dpf) were exposed to MPTP and different fractions of EUOL extract. The 30% EF was identified to have the best anti-PD activity by evaluating the development of dopaminergic neurons and neuronal vasculature in the brain at 4 dpf. At 6 dpf, we monitored zebrafish behavior and tested the expression of autophagy-related genes. Then, we verified the anti-PD activity of 30% EF using the zebrafish and cellular PD model by detecting the expression of α-syn and LC3B. Finally, we investigated the underlying neuroprotective mechanism by locomotion assays, molecular docking simulation, and SPR.

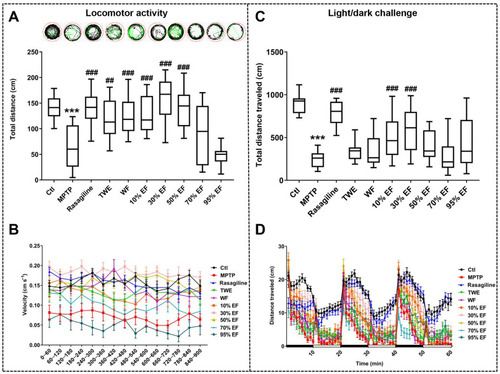
Effect of different fractions of EUOL extract on zebrafish PD-like behavior. (A,C) Quantitative analysis of total distance traveled by zebrafish (n = 24, *** p < 0.001 vs. Ctl; ## p < 0.01, ### p < 0.001 vs. MPTP). (B,D) Average swimming speed of zebrafish (n = 24). The high-speed, medium-speed, and low-speed movement of zebrafish is depicted in red, green, and black lines, respectively.

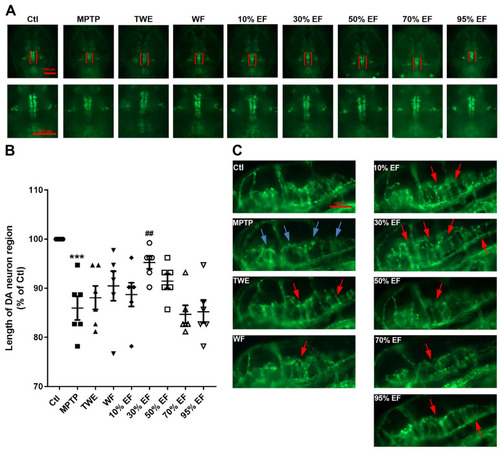
The protective effect of different fractions of EUOL extract on dopaminergic neurons and blood vessels in zebrafish PD model. (A) Representative fluorescence microscopy images of dopaminergic neuron regions in zebrafish (red brackets). (B) Statistical analysis of the length of the dopaminergic neuron regions of different treated groups (n = 12, *** p < 0.001 vs. Ctl; ## p < 0.01 vs. MPTP). (C) Representative fluorescence images of zebrafish in different treated groups. Blue arrows indicate the loss of cerebral vessels, while red arrows indicate cerebral vessels recovery. The scale bar is 100 µm.

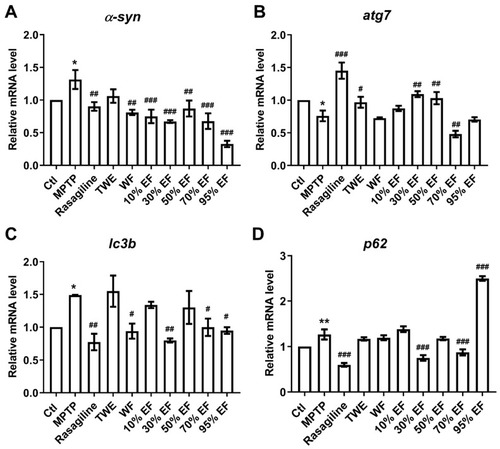
The expression of key genes involved in PD after the treatment with different fractions of EUOL extract. The amount of gene expression ((
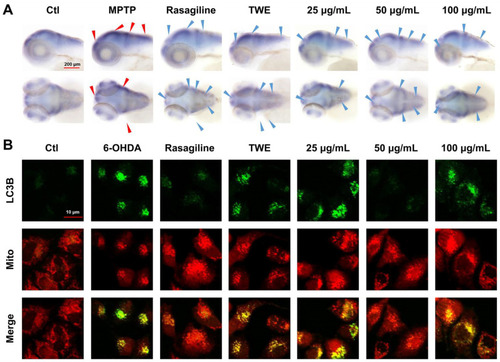
A): α-syn, (B): atg7, (C): lc3b, and (D): p62) was exhibited as the relative expression compared with the Ctl. n  =  3, * p  <  0.05, ** p  <  0.01 vs. Ctl; # p  <  0.05, ## p  <  0.01, ### p  <  0.001 vs. MPTP.

Effect of 30% EF on α-syn levels in zebrafish brains and LC3B expression in SH-SY5Y cells. (A) The expression of α-syn in the CNS of zebrafish larvae after TWE or 30% EF treatment. Red and blue arrows indicate increased and decreased expression of α-syn compared to Ctl and MPTP groups, respectively. The scale bar: 200 µm. (B) Subcellular distribution of GFP-LC3B and RFP-Mito were visualized on a confocal microscope. Scale bar: 10 μm.

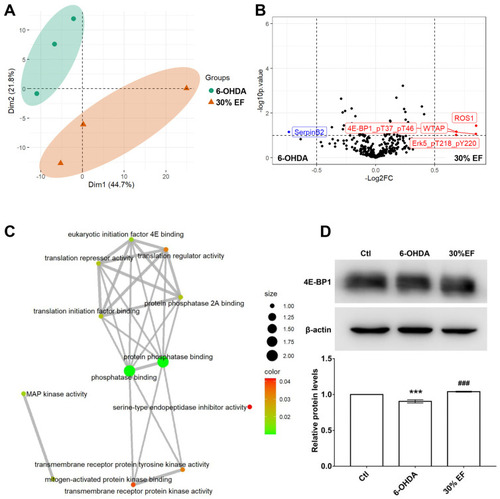
Preliminarily unveiling the underlying mechanism of the 30% EF against PD. (A) The PCA of the two datasets. Groups are labeled by different colors (green represents the 6-OHDA group; orange represents the 30% EF group). Microarray platforms are labeled by different shapes (circle represents 6-OHDA group; triangle represents 30% EF group). (B) The volcano plot shows differential protein expressions, comparing 6-OHDA vs. Ctl groups. Blue dots denote down-regulated proteins, red dots indicate up-regulated proteins, and black dots signify proteins with non-significant expression changes. (C) GO biological function analysis. (D) Western blot analysis of 4E-BP1. *** p <  0.001 vs. Ctl; ### p  <  0.001 vs. 6-OHDA.

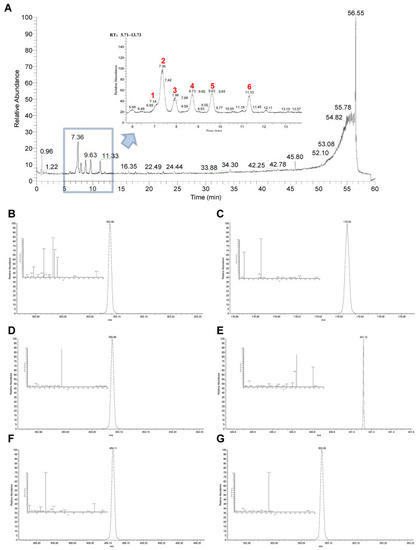
Total ion chromatograms and mass spectrogram of the main components of 30% EF using UPLC-Q-Exactive Orbitrap/MS. (A) Total ion chromatograms (peaks 1–6 correspond to the compounds shown in panels (BG). (BG) Mass spectrum of cryptochlorogenic acid, caffeic acid, chlorogenic acid, asperulosidic acid, asperuloside, and chlorogenic acid isomer in negative ion mode.

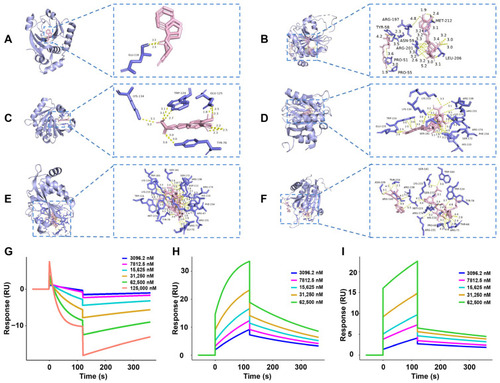
The strong binding ability of the main components in 30% EF with 4E-BP1. (AF) The binding interaction of 4E-BP1 with rasagiline, cryptochlorogenic acid, caffeic acid, chlorogenic acid, asperulosidic acid, and asperuloside, respectively. (GI) SPR analysis of the binding affinity of cryptochlorogenic acid, caffeic acid, and chlorogenic acid to 4E-BP1, respectively.

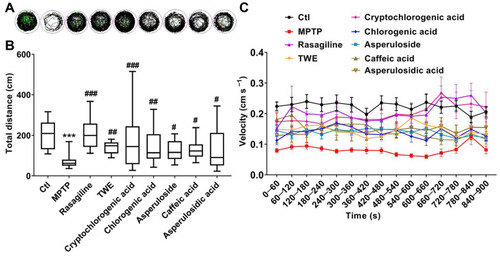
Anti-PD action of the main components in the key active constituent 30% EF by analyzing PD-like behavior. (A) The behavioral trajectories of zebrafish under pharmacological intervention. The zebrafish’s high-speed, medium-speed, and low-speed movement is depicted in red, green, and black lines, respectively. (B) The total distance traveled by zebrafish with different treatments (n = 24, *** p < 0.001 vs. Ctl; # p  <  0.05, ## p  <  0.01, ### p  <  0.001 vs. MPTP). (C) Average swimming speed of zebrafish.

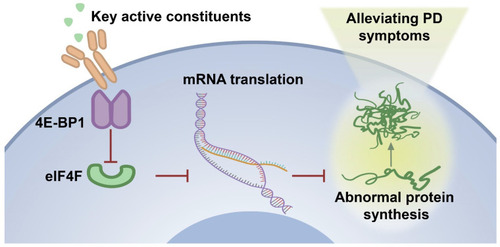
The proposed mechanism underlying the effect of 30% EF on activating 4E-BP1 under PD conditions. MPTP-induced intracellular alterations lead to a decrease in 4E-BP1 expression, enhancing eIF4F complex formation and potentially facilitating abnormal protein synthesis. In contrast, the application of 30% EF counteracts these effects by up-regulating 4E-BP1, which restores translational homeostasis and cellular damage, ultimately alleviating Parkinsonian symptoms.

Acknowledgments
This image is the copyrighted work of the attributed author or publisher, and ZFIN has permission only to display this image to its users. Additional permissions should be obtained from the applicable author or publisher of the image. Full text @ Int. J. Mol. Sci.