IMAGE

Figure 5

ID
ZDB-IMAGE-250329-11
Source
Figures for Li et al., 2025
Image
Figure Caption

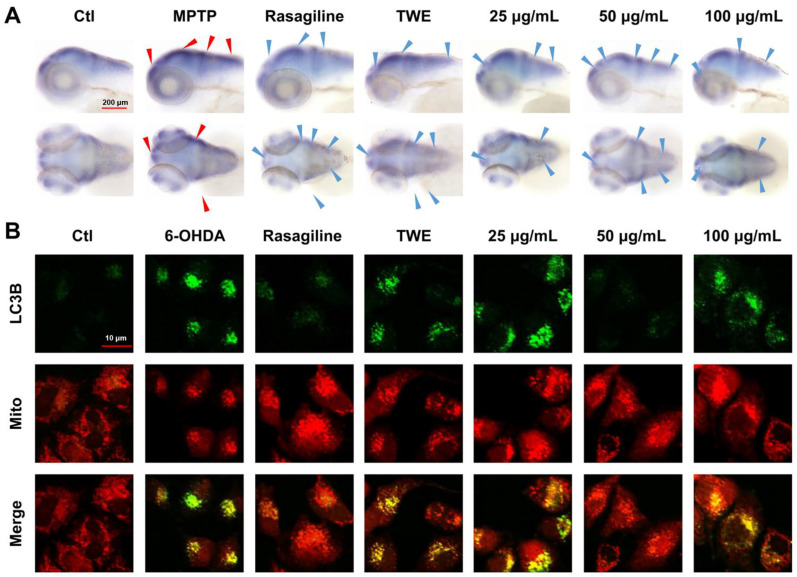
Figure 5

Effect of 30% EF on α-syn levels in zebrafish brains and LC3B expression in SH-SY5Y cells. (A) The expression of α-syn in the CNS of zebrafish larvae after TWE or 30% EF treatment. Red and blue arrows indicate increased and decreased expression of α-syn compared to Ctl and MPTP groups, respectively. The scale bar: 200 µm. (B) Subcellular distribution of GFP-LC3B and RFP-Mito were visualized on a confocal microscope. Scale bar: 10 μm.

Acknowledgments
This image is the copyrighted work of the attributed author or publisher, and ZFIN has permission only to display this image to its users. Additional permissions should be obtained from the applicable author or publisher of the image. Full text @ Int. J. Mol. Sci.