
FIGURE
Figure 5
- ID
- ZDB-FIG-250329-5
- Publication
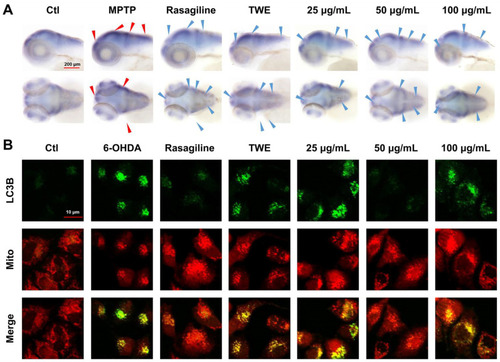
- Li et al., 2025 - Identification of Key Active Constituents in Eucommia ulmoides Oliv. Leaves Against Parkinson's Disease and the Alleviative Effects via 4E-BP1 Up-Regulation
- Other Figures
- All Figure Page
- Back to All Figure Page
Figure 5
Effect of 30% EF on |
Expression Data
Expression Detail
Antibody Labeling
Phenotype Data
Phenotype Detail
Acknowledgments
This image is the copyrighted work of the attributed author or publisher, and
ZFIN has permission only to display this image to its users.
Additional permissions should be obtained from the applicable author or publisher of the image.
Full text @ Int. J. Mol. Sci.