FIGURE

Figure 6

ID
ZDB-FIG-250329-6
Publication
Li et al., 2025 - Identification of Key Active Constituents in Eucommia ulmoides Oliv. Leaves Against Parkinson's Disease and the Alleviative Effects via 4E-BP1 Up-Regulation
Other Figures
All Figure Page
Back to All Figure Page
Figure 6

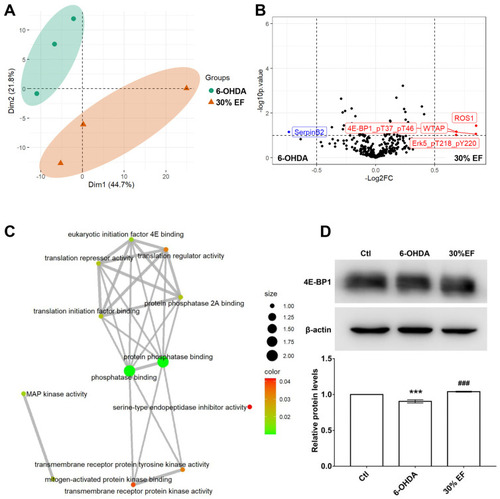
Preliminarily unveiling the underlying mechanism of the 30% EF against PD. (A) The PCA of the two datasets. Groups are labeled by different colors (green represents the 6-OHDA group; orange represents the 30% EF group). Microarray platforms are labeled by different shapes (circle represents 6-OHDA group; triangle represents 30% EF group). (B) The volcano plot shows differential protein expressions, comparing 6-OHDA vs. Ctl groups. Blue dots denote down-regulated proteins, red dots indicate up-regulated proteins, and black dots signify proteins with non-significant expression changes. (C) GO biological function analysis. (D) Western blot analysis of 4E-BP1. *** p <  0.001 vs. Ctl; ### p  <  0.001 vs. 6-OHDA.

Expression Data

Expression Detail
Antibody Labeling
Phenotype Data

Phenotype Detail
Acknowledgments
This image is the copyrighted work of the attributed author or publisher, and ZFIN has permission only to display this image to its users. Additional permissions should be obtained from the applicable author or publisher of the image. Full text @ Int. J. Mol. Sci.