
Image
|
Figure Caption
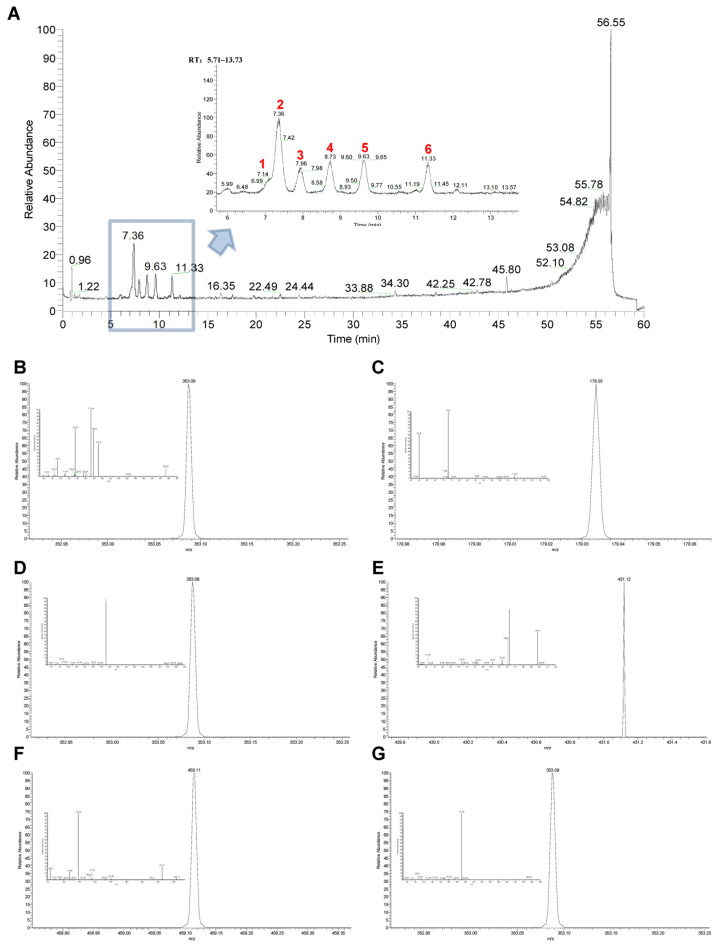
Figure 7
Total ion chromatograms and mass spectrogram of the main components of 30% EF using UPLC-Q-Exactive Orbitrap/MS. (
Acknowledgments
This image is the copyrighted work of the attributed author or publisher, and
ZFIN has permission only to display this image to its users.
Additional permissions should be obtained from the applicable author or publisher of the image.
Full text @ Int. J. Mol. Sci.