
- Title
-
Tubulin glutamylation regulates axon guidance via the selective tuning of microtubule-severing enzymes
- Authors
- Ten Martin, D., Jardin, N., Vougny, J., Giudicelli, F., Gasmi, L., Berbée, N., Henriot, V., Lebrun, L., Haumaître, C., Kneussel, M., Nicol, X., Janke, C., Magiera, M.M., Hazan, J., Fassier, C.
- Source
- Full text @ EMBO J.
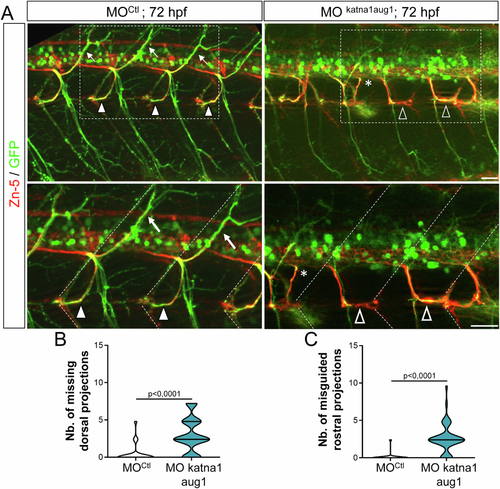
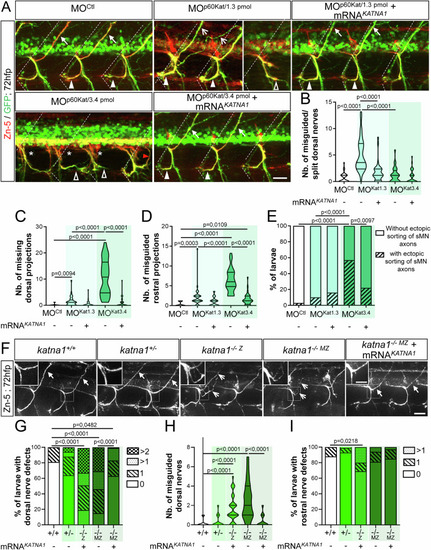
p60-katanin knockdown with MOkatna1aug1 morpholino induces similar spinal motor axon defects to MOp60Kat morpholino. (A) Immunolabelling of secondary motoneuron (sMN) axon tracts in 72 h post-fertilisation (hpf) transgenic Tg(Hb9:GFP) larvae injected with control (n = 40) or MOkatna1aug1 (n = 40) morpholinos, using Zn-5 and GFP antibodies. Lateral views of the trunk, anterior to the left. Bottom panels represent higher magnifications of the boxed region in the corresponding top panels. Dotted lines delineate lateral myosepta. Full arrowheads and full arrows point at normal rostral and dorsal nerves, respectively. Empty arrowheads show misguided rostral nerves. Asterisks indicate ectopic sorting points of sMN axons from the spinal cord. (B, C) Quantifications of sMN defects in larvae analysed in panel A and pooled from three independent experiments. Mean number of missing dorsal nerves (B) and misguided rostral nerves (C) per larva. Non-blind quantifications were performed on 24 spinal hemisegments located around the yolk tube per larva. Violin Plots; horizontal bars indicate the median ± the 1st and 3rd quartiles. Mann–Whitney test. P values are displayed on graphs. Source data are available online for this figure. |
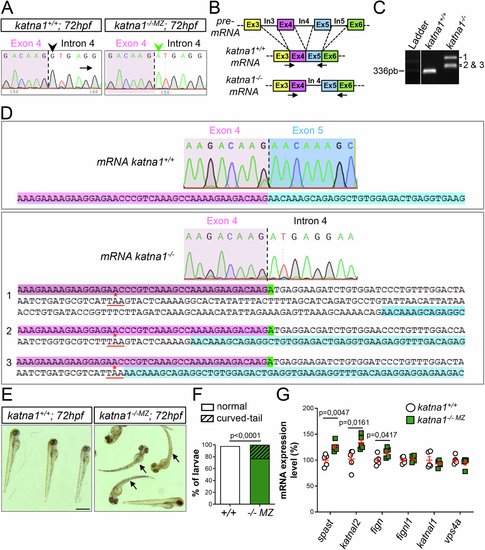
Molecular and morphological characterisation of zebrafish katna1 mutants. (A) Sequence analysis of control and katna1 mutant genomic DNA. Dotted line indicates the junction between exon 4 (pink background) and intron 4 (white background). The green arrowhead points at the nucleotide substitution (G > A) affecting the donor splice site of intron 4 (G in control, black arrowhead) in katna1 mutants. (B) Schematic representation of the RT-PCR strategy used to test the impact of the katna1 splice-site mutation on katna1 mRNA splicing. Dotted lines indicate intron splicing. Arrows represent the primers used for RT-PCR analysis. Primers were designed on exon/intron junctions to avoid contamination by genomic DNA amplification. In: intron; Ex: exon. (C) RT-PCR analysis of katna1 intron-4 splicing on total RNA extracts from katna1+/+ and katna1-/- MZ maternal zygotic mutant embryos. Homozygous katna1-/- MZ embryos lack wild-type transcript and show different populations of misspliced transcripts (1, 2 and 3). (D) Sequence analysis of katna1 misspliced transcripts. Sequences corresponding to exon 4, intron 4 and exon 5 are respectively indicated in pink, white and blue. The splice-site mutation is highlighted in green. Misspliced transcripts include various sized insertions of intron 4, which all lead to a frameshift and the occurrence of a premature stop codon at the same amino-acid position (red asterisk). (E) Gross morphology of 72-hpf control (katna1+/+) and maternal zygotic katna1 mutant (katna1-/-MZ) larvae. Arrows point at the curved-tail phenotype of some mutant larvae. Scale bar: 0.5 mm. (F) Percentage of larvae exhibiting a curved-tail phenotype. Chi2 test. (G) RT-qPCR analysis showing the differential expression levels of p60-katanin-related genes from the ATPase Meiotic Clade in control and katna1-/- MZ larvae. RNAs were extracted from 5 independent pools of 10 katna1+/+, 10 katna1-/-MZ and one pool of 10 wild-type embryos at 24 hpf. Unpaired t test. Values are shown as means ± SEM. (F, G) P values are displayed on graphs. Source data are available online for this figure. |
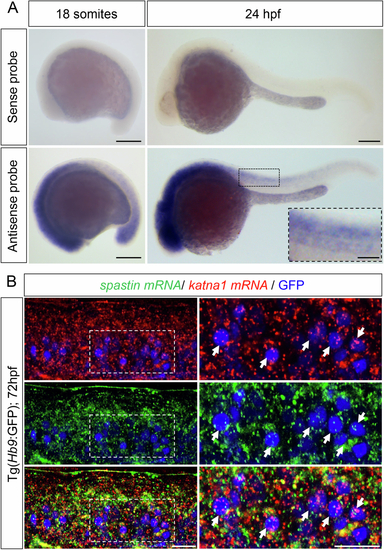
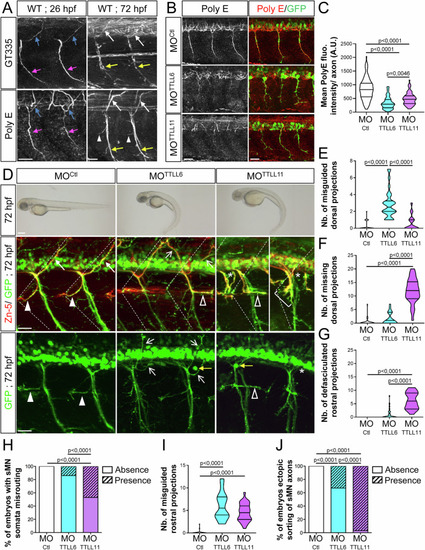
p60-katanin and spastin transcripts are both expressed in developing spinal motor neurons. (A) Whole-mount in situ hybridisation with p60-katanin sense (upper panel) and antisense (bottom panel) riboprobes at 18 somites and 24 h post-fertilisation (hpf). Lateral views of the embryos, anterior to the left. P60-katanin is highly enriched in the developing nervous system at both 18 somites and 24 hpf, two stages at which the axons of primary (pMN) and secondary (sMN) motor neurons exit the spinal cord to navigate towards their muscle targets. Scale bars: 200 µm. (B) In toto hybridisation chain reaction (HCR) on 72-hpf Tg(Hb9:GFP) larvae using zebrafish spastin and katna1 probes. Lateral view of the trunk, anterior to the left. Right panels are higher magnifications of boxed region of the corresponding left panel. Arrows point at spinal motor neurons co-expressing katna1 and spastin transcripts. Scale bars: 20 µm. Source data are available online for this figure. |
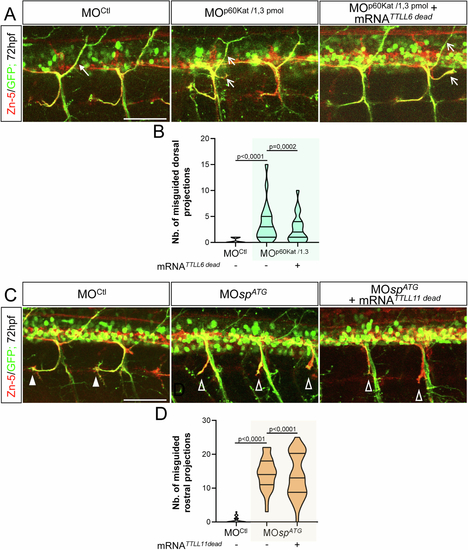
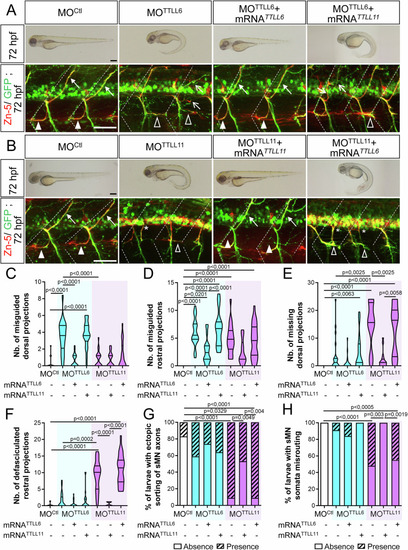
Overexpression of a catalytic-dead variant of TTLL6 or TTLL11 respectively fails to rescue the axon pathfinding errors associated with p60-Katanin or Spastin partial knockdown. (A) Immunolabelling of sMN axon tracts using Zn-5 and GFP antibodies in 72-hpf Tg(Hb9:GFP) larvae injected with MOCtl (n = 29), MOp60Kat/1.3pmol (n = 21) or co-injected with MOp60Kat/1.3pmol and the mRNA encoding a catalytic-dead variant of TTLL6 (TTLL6dead) (n = 23). Full and empty arrows respectively point at normal and misguided dorsal projections. (B) Mean number of split/misguided dorsal nerves per larva. Quantifications were conducted on the larval set analysed in (A). (C) Immunolabelling of sMN axon tracts using Zn-5 and GFP antibodies in 72-hpf Tg(Hb9:GFP) larvae injected with MOCtl (n = 27), MOspATG (n = 27) or co-injected with MOspATG and the transcript encoding a catalytic-dead variant of TTLL11 (TTLL11dead) (n = 34). Full and empty arrowheads indicate normal and misguided rostral projections, respectively. (D) Mean number of misguided rostral nerves per larva. Quantifications were conducted on the larval set analysed in (B). (A, C) Scale bars: 50 μm. (B, D) Non-blind quantifications were performed on 24 spinal hemisegments located around the yolk tube per larva. Analysed larvae were pooled from three independent experiments. Violin Plots; horizontal bars indicate the median ± the 1st and 3rd quartiles. Kruskal–Wallis ANOVA test with Dunn’s post hoc test. P values are displayed on graphs. Source data are available online for this figure. |
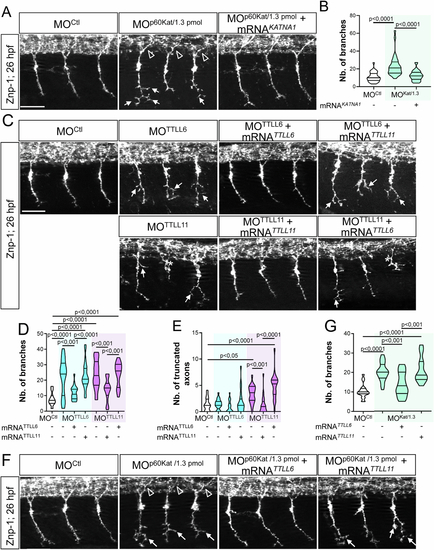
TTLL6 also tunes p60-Katanin-driven pMN axon development. (A) Immunolabelling of pMN axons in 26-hpf embryos injected with MOCtl (n = 32), MOp60Kat/1.3pmol (n = 32) or co-injected with MOp60Kat/1.3pmol and 120 pg of human KATNA1 transcripts (MOp60Kat/1.3pmol + mRNAKATNA1, n = 32) using Znp-1 antibody. (B) Mean number of pMN axon branches per embryo analysed in the panel-A embryo set. (C) Immunodetection of pMN axons with Znp-1 antibody in 26-hpf embryos injected with MOCtl (n = 19), MOTTLL6 (n = 22), MOTTLL11 (n = 19) morpholinos or co-injected with MOTTLL6 or MOTTLL11 and mouse TTLL6 or TTLL11 mRNA (MOTTLL6 + mRNATTLL6, n = 20; MOTTLL6 + mRNATTLL11, n = 21; MOTTLL11 + mRNATTLL11, n = 19; MOTTLL11 + mRNATTLL6, n = 18). (D, E) Mean number of CaP pMN branches (D) and truncated CaP axons per embryo analysed in the panel-C embryo set. (F) Immunostaining of pMN axons with Znp-1 antibody in 26-hpf embryos injected with MOCtl, (n = 20), MOp60Kat/1.3pmol (n = 21) or co-injected with MOp60Kat/1.3pmol and mouse TTLL6 (MOp60Kat/1.3pmol + mRNATTLL6, n = 19) or TTLL11 mRNA (MOp60Kat/1.3pmol + mRNATTLL11, n = 16). (G) Mean number of CaP pMN branches per embryo analysed in the panel-F embryo set. (A, C, F) Arrows and asterisk respectively indicate hyper-branched and truncated ventrally projecting pMN CaP axons. Empty arrowheads indicate normal dorsally projecting pMN MiP axons. Scale bars: 25 μm. (B, D, E, G) Non-blind quantifications were performed on 24 spinal hemisegments located around the yolk tube per embryo. Analysed larvae were pooled from three independent experiments. Violin Plots; horizontal bars indicate the median ± the 1st and 3rd quartiles. One-way ANOVA test with Bonferroni’s post test (D, G) or Kruskal–Wallis ANOVA test with Dunn’s post test (B, E). P values are displayed on graphs. Source data are available online for this figure. |
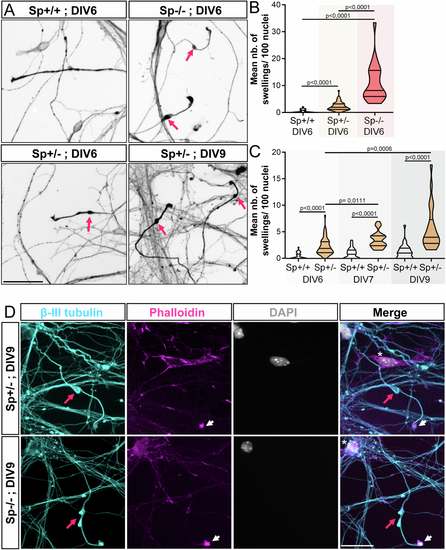
Mouse Sp + /- cortical neurons exhibit a significant number of axonal swellings. (A) Mouse Sp + /+, Sp + /- and Sp-/- cultured cortical neurons immunolabelled with a βIII-tubulin antibody at different days in vitro (DIV). Pink arrows point at axonal swellings. Scale bars: 50 µm. (B, C) Mean number of axonal swellings per 100 nuclei. At least 2500 neurons from two independent experiments were analysed in unblind manner per condition. Violin Plots; horizontal bars indicate the median ± the 1st and 3rd quartiles. Kruskal–Wallis ANOVA test with Dunn’s post hoc test. P values are displayed on graphs. (D) Primary culture of Sp + /- and Sp-/- cortical neurons immunolabelled at DIV9 with βIII-tubulin antibodies, F-actin probes (Phalloidin, pink) and DAPI (grey). Axonal swellings (pink arrows) of Sp + /- exhibit the same characteristic features as those described in Sp-/- cultures. They are (i) always located close to the growth cone (arrowheads), (ii) their diameter is at least 2 to 3 times larger than the diameter of the axon shaft, (iii) they are always strongly labelled by tubulin antibodies and (iv) are always negative for DAPI staining (asterisk). Scale bars: 25 µm. Source data are available online for this figure |
( |
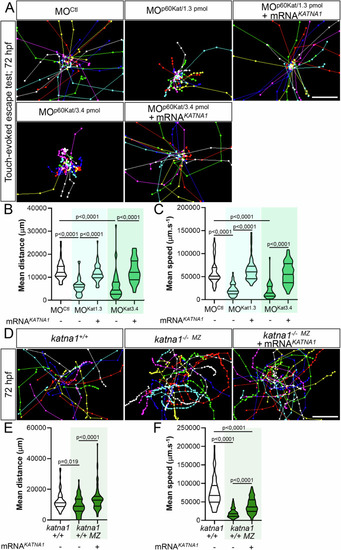
Loss of p60-Katanin causes a dramatic decrease in zebrafish larval mobility. ( |
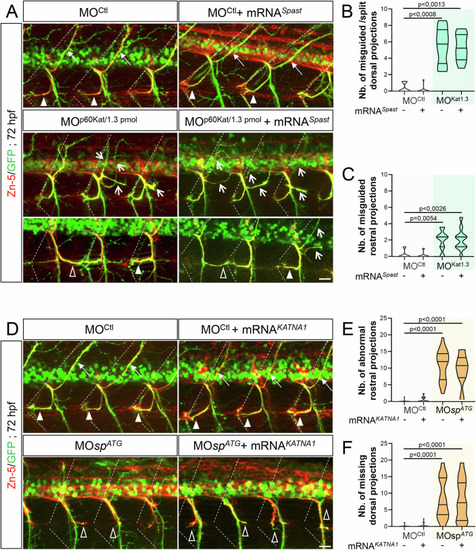
Spastin and p60-katanin have non-redundant roles in motor axon guidance. ( |
( |
TTLL6 and TTLL11 play non-overlapping roles in spinal motor axon navigation. ( |
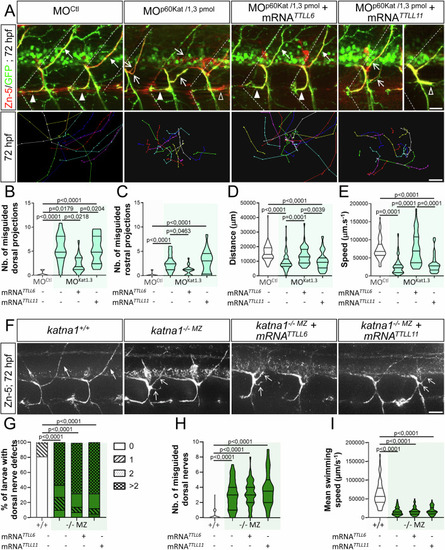
Selective regulation of p60-Katanin activity by TTLL6 is required for zebrafish motor axon targeting and larval locomotion. ( |
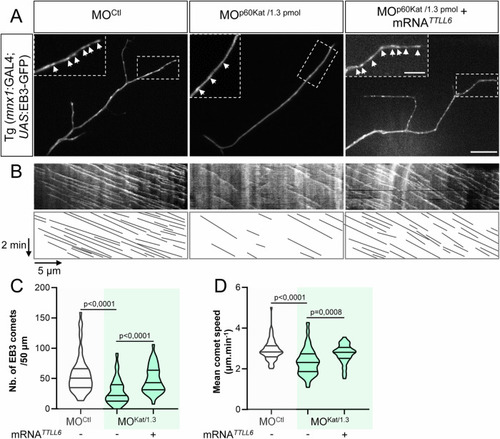
TTLL6 overexpression rescues the defects of MT dynamics caused by the partial loss of p60-Katanin MT-severing activity in navigating motor axons. ( |
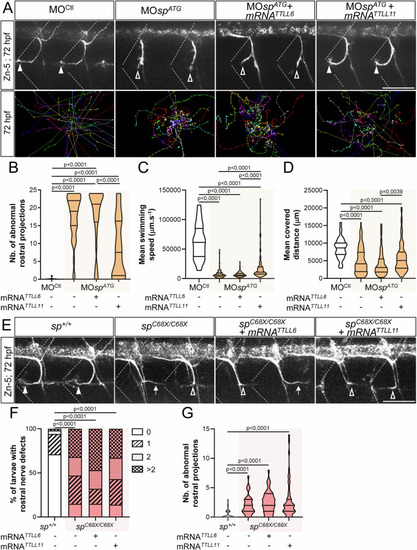
Selective regulation of spastin activity by TTLLL11 controls zebrafish motor circuit wiring and larval motility. ( |
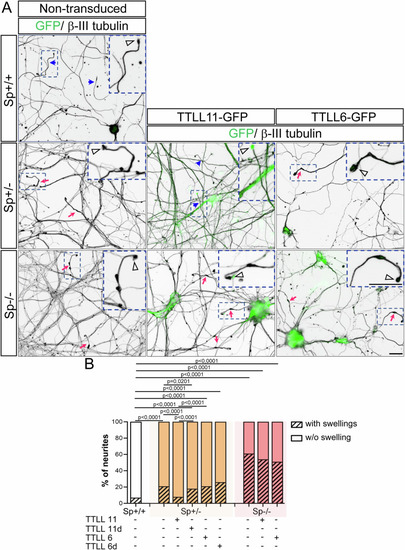
TTLL11, but not TTLL6, rescues the axonal swelling phenotype caused by spastin haploinsufficiency in mammalian cortical neurons. ( |
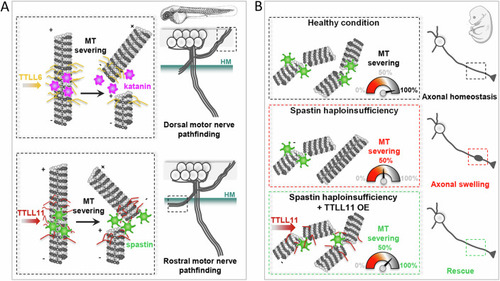
Schematic representation of MT-severing enzyme selective regulation by specific TTLL enzymes in zebrafish and mammalian neurons. ( |