IMAGE

Figure 6

ID
ZDB-IMAGE-250109-316
Source
Figures for Ten Martin et al., 2024
Image
Figure Caption

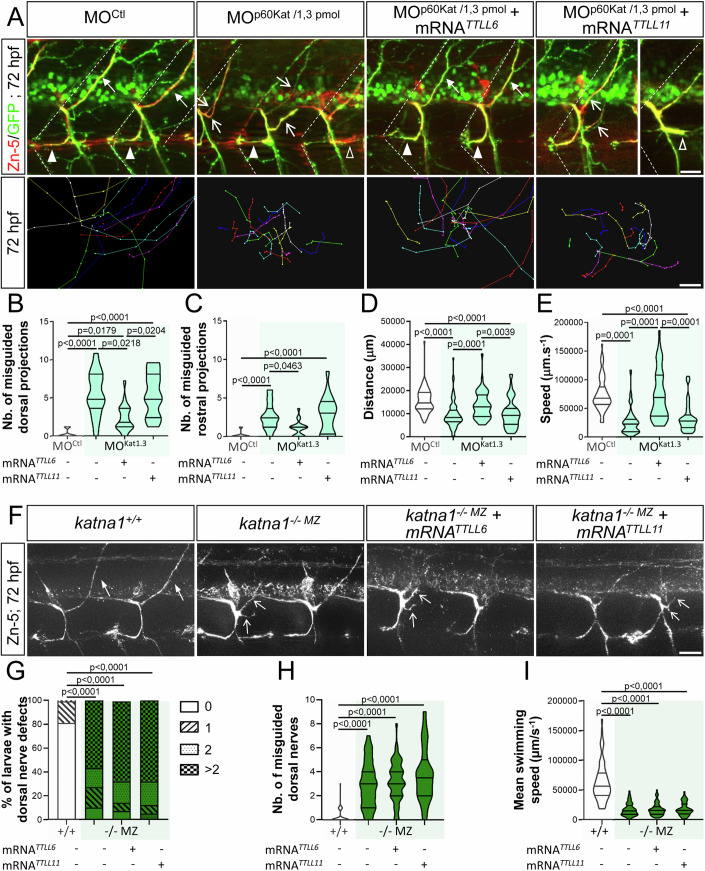
Figure 6 Selective regulation of p60-Katanin activity by TTLL6 is required for zebrafish motor axon targeting and larval locomotion.

(A) Upper panels: Immunolabelling of sMN axon tracts using Zn-5 and GFP antibodies in 72-hpf Tg(Hb9:GFP) larvae injected with MOCtl (n = 20), MOp60Kat/1.3pmol (n = 20) or co-injected with MOp60Kat/1.3pmol and mouse TTLL6 (n = 19) or TTLL11 (n = 20) mRNAs. Dotted lines delineate lateral myosepta. Lower panels: Tracking analysis of 72-hpf larvae injected with MOCtl (n = 30), MOp60Kat/1.3pmol (n = 30) or co-injected with MOp60Kat/1.3pmol and mouse TTLL6 (n = 30) or TTLL11 (n = 30) mRNAs in a touch-evoked escape response test. Each line represents the trajectory of one larva after touch stimulation while the distance between two dots indicates the distance covered by a larva between two consecutive frames. Scale bar: 5 mm. (BE) Quantifications of the sMN and locomotor defects of larvae analysed in (A) and pooled from three independent experiments. Mean number of split/misguided dorsal nerves (B) and misrouted rostral nerves (C) per larva. (D, E) Mean swimming covered distance (D) and speed (E). (F) Immunolabelling of sMN axon tracts with Zn-5 antibody in 72-hpf katna1+/+ (n = 57), katna1-/-MZ (n = 61) and katna1-/-MZ larvae injected with mouse TTLL6 (n = 56) or TTLL11 (n = 54) mRNAs. (A, F) Full arrowheads and full arrows point at normal rostral and dorsal projections while empty arrowheads and empty arrows indicate misguided rostral and dorsal tracts, respectively. Scale bar: 25 μm. (GI) Quantifications of dorsal nerve and motility defects of larvae analysed in (F) and pooled from two independent experiments. (G) Percentage of larvae with dorsal nerve defects. (H) Mean number of split/misguided dorsal nerves per larva. (I) Mean larval swimming speed in the escape-touch response test. Swimming speed values were extracted from tracking analysis of 72-hpf katna1+/+ (n = 65), katna1-/-MZ (n = 74) and katna1-/-MZ larvae injected with the mRNAs encoding mouse TTLL6 (n = 78) or TTLL11 (n = 47). (B, C, G, H) Non-blind quantifications were performed on 24 spinal hemisegments located around the yolk tube per larva. (BE, H, I) Violin Plots; horizontal bars indicate the median ± the 1st and 3rd quartiles. Kruskal–Wallis ANOVA test with Dunn’s post hoc test. (G) Chi2 test. P values are displayed on graphs. Source data are available online for this figure.

Acknowledgments
This image is the copyrighted work of the attributed author or publisher, and ZFIN has permission only to display this image to its users. Additional permissions should be obtained from the applicable author or publisher of the image. Full text @ EMBO J.