
|
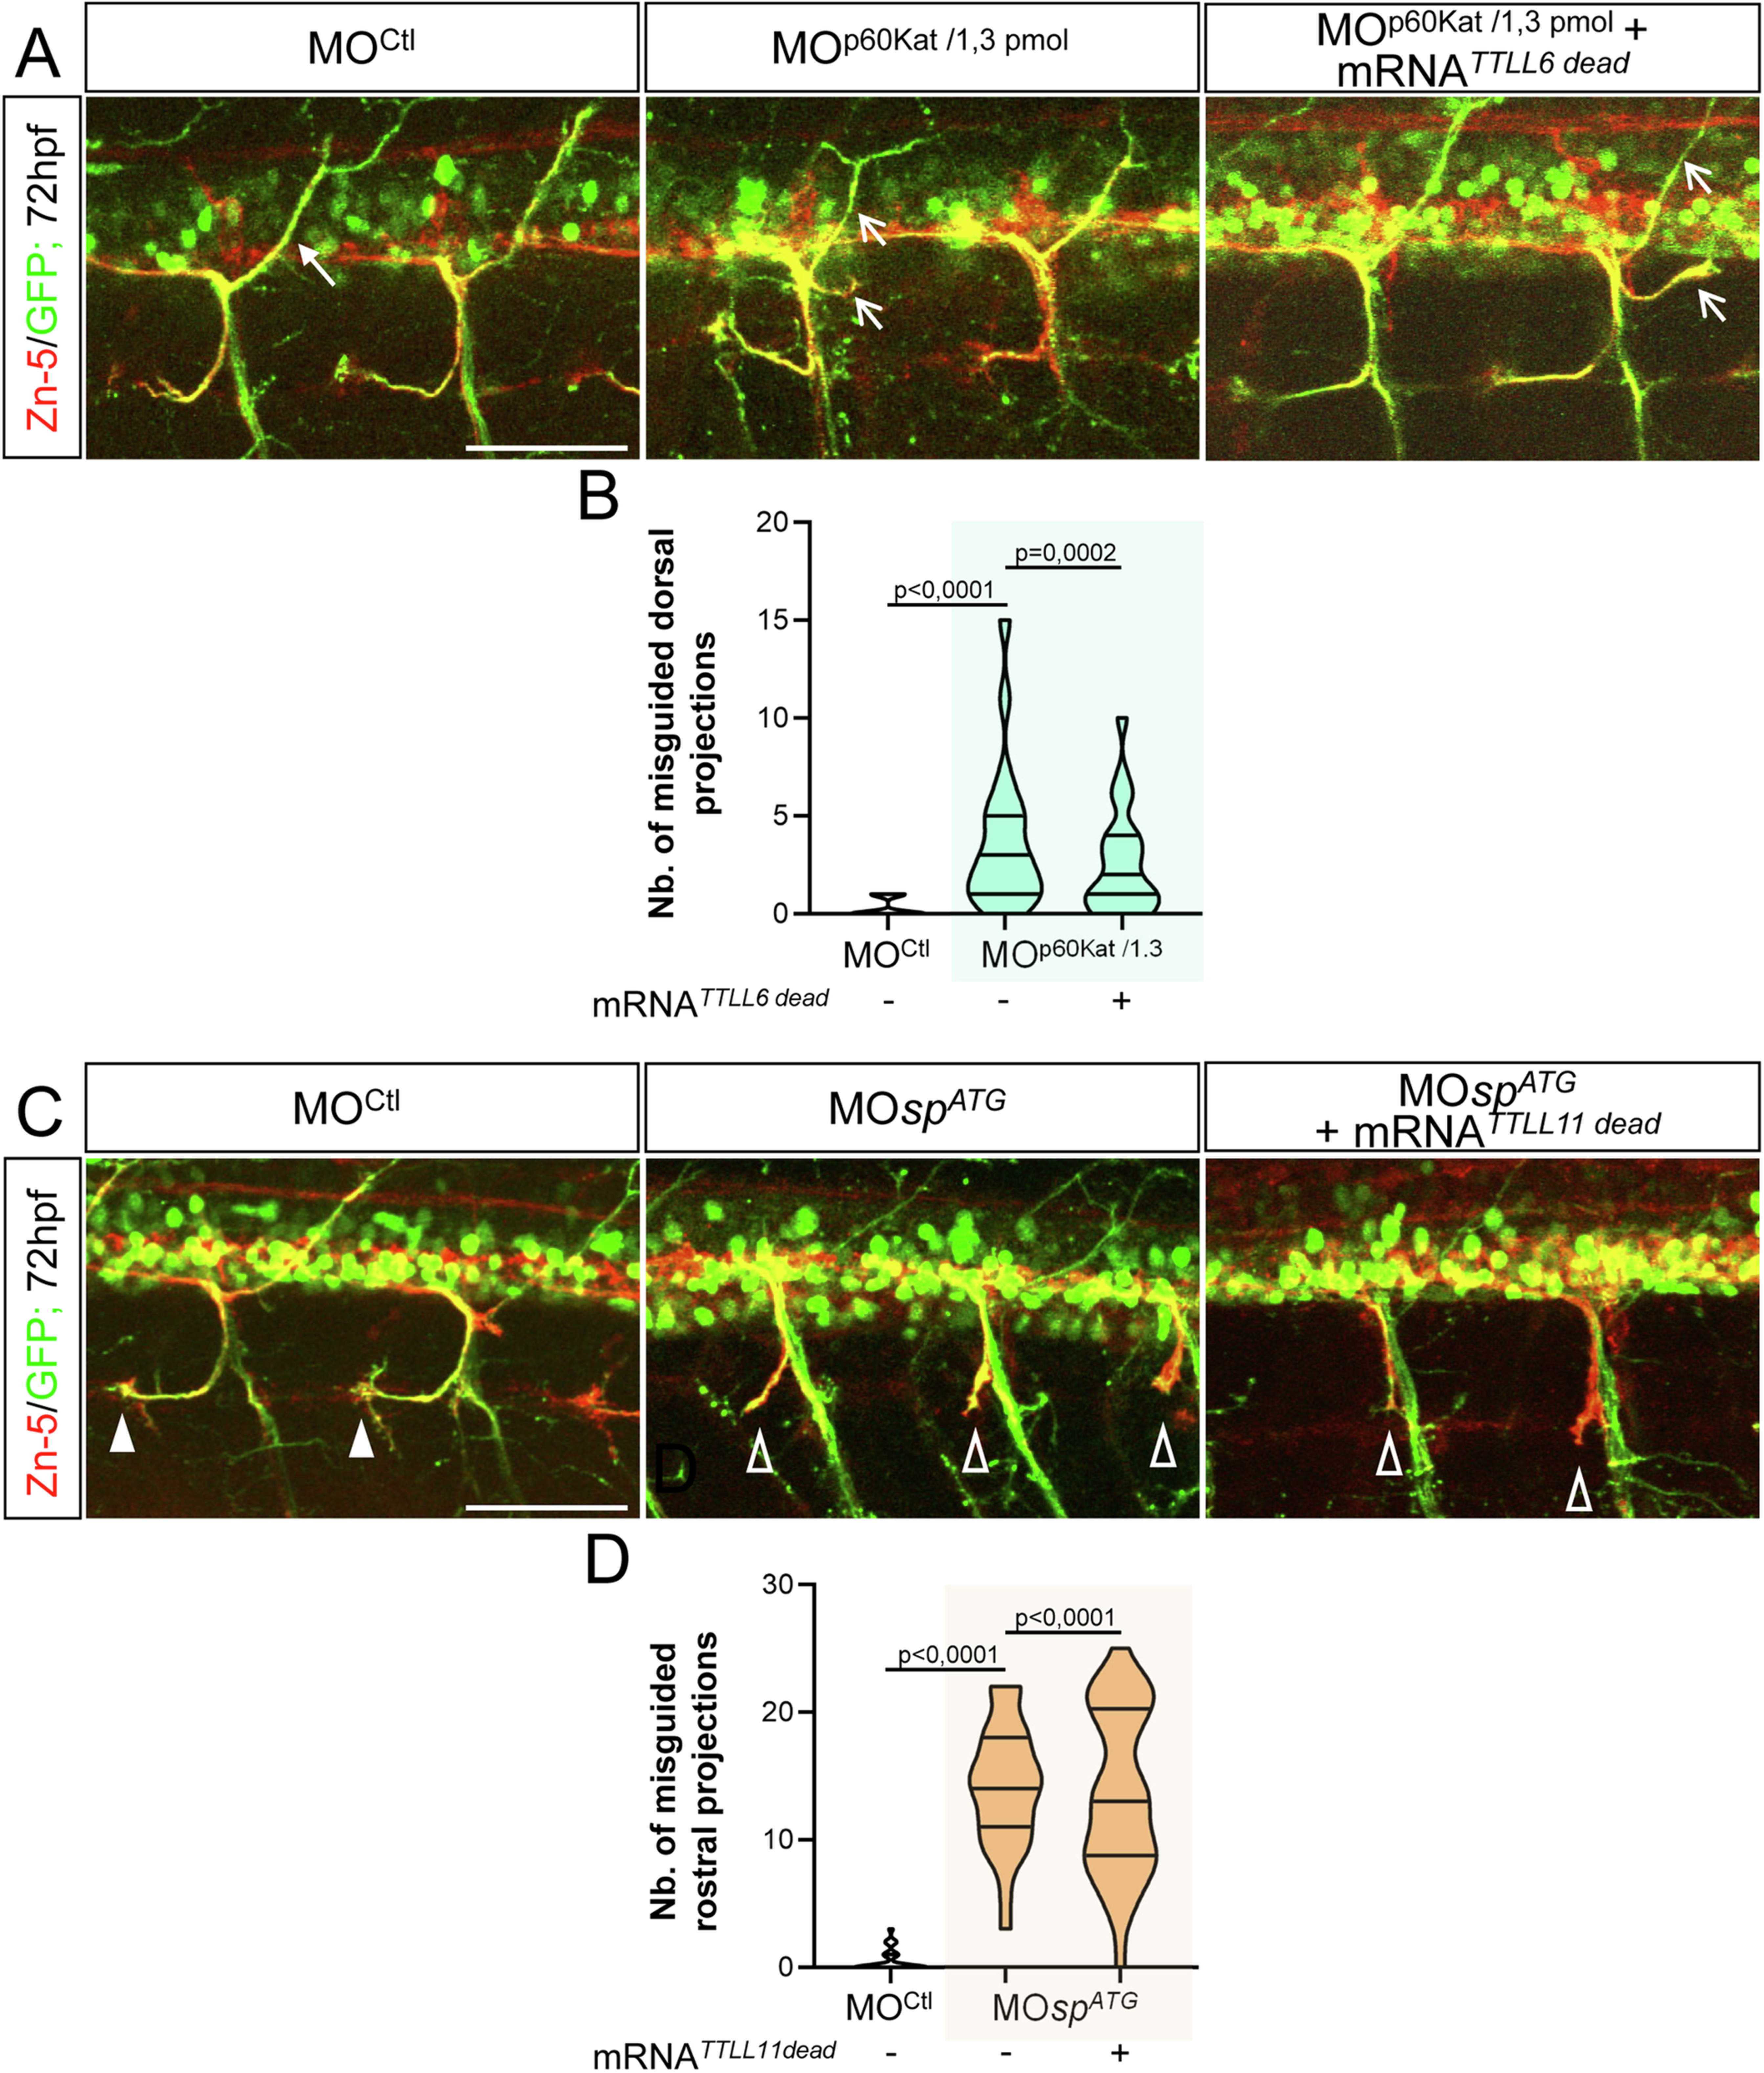
Fig. EV4 Overexpression of a catalytic-dead variant of TTLL6 or TTLL11 respectively fails to rescue the axon pathfinding errors associated with p60-Katanin or Spastin partial knockdown. (A) Immunolabelling of sMN axon tracts using Zn-5 and GFP antibodies in 72-hpf Tg(Hb9:GFP) larvae injected with MOCtl (n = 29), MOp60Kat/1.3pmol (n = 21) or co-injected with MOp60Kat/1.3pmol and the mRNA encoding a catalytic-dead variant of TTLL6 (TTLL6dead) (n = 23). Full and empty arrows respectively point at normal and misguided dorsal projections. (B) Mean number of split/misguided dorsal nerves per larva. Quantifications were conducted on the larval set analysed in (A). (C) Immunolabelling of sMN axon tracts using Zn-5 and GFP antibodies in 72-hpf Tg(Hb9:GFP) larvae injected with MOCtl (n = 27), MOspATG (n = 27) or co-injected with MOspATG and the transcript encoding a catalytic-dead variant of TTLL11 (TTLL11dead) (n = 34). Full and empty arrowheads indicate normal and misguided rostral projections, respectively. (D) Mean number of misguided rostral nerves per larva. Quantifications were conducted on the larval set analysed in (B). (A, C) Scale bars: 50 μm. (B, D) Non-blind quantifications were performed on 24 spinal hemisegments located around the yolk tube per larva. Analysed larvae were pooled from three independent experiments. Violin Plots; horizontal bars indicate the median ± the 1st and 3rd quartiles. Kruskal–Wallis ANOVA test with Dunn’s post hoc test. P values are displayed on graphs. Source data are available online for this figure.