|
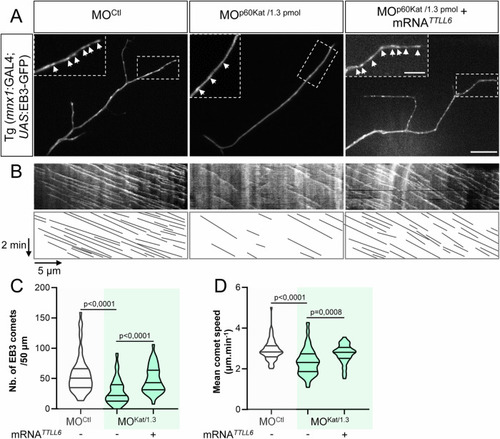
TTLL6 overexpression rescues the defects of MT dynamics caused by the partial loss of p60-Katanin MT-severing activity in navigating motor axons. (A) Representative z-projection still images of EB3-GFP comet time-lapse recordings in sMN axons of 52-hpf Tg(Mnx1:GAL4;UAS:EB3-GFP) larvae injected with MOCtl, MOp60Kat/1.3pmol, or co-injected with MOp60Kat/1.3pmol and mouse TTLL6 mRNAs (related to Movie EV4). Arrowheads point at MT plus ends (i.e., EB3-GFP comets). Insets are higher magnifications of the boxed axonal portion. Scale bars: 5 μm and 2 μm (insets). (B) Upper panels: Representative kymograms of a 5-min EB3-GFP recording. Lower panels: Schematic representation of the corresponding kymograms illustrating the EB3-GFP traces. Horizontal bar, 5 µm; vertical bar, 2 min. (C, D) Mean number of EB3 comets per 50 μm of axon (C) and mean EB3 comet velocity (D). MT plus-end dynamics was monitored and quantified in a non-blind manner in 58, 74 and 38 dorsally projecting sMN axons of 72-hpf larvae injected with MOCtl, MOp60Kat/1.3pmol or co-injected with MOp60Kat/1.3pmol and mouse TTLL6 mRNAs, respectively. These axons were obtained from at least 6 larvae per condition and pooled from four independent experiments. Violin Plots; horizontal bars indicate the median ± the 1st and 3rd quartiles. Kruskal–Wallis ANOVA test with Dunn’s post hoc test. P values are displayed on graphs. Source data are available online for this figure.
|