
Fig. Ev2
- ID
- ZDB-FIG-250131-2
- Publication
- Ten Martin et al., 2024 - Tubulin glutamylation regulates axon guidance via the selective tuning of microtubule-severing enzymes
- Other Figures
- All Figure Page
- Back to All Figure Page
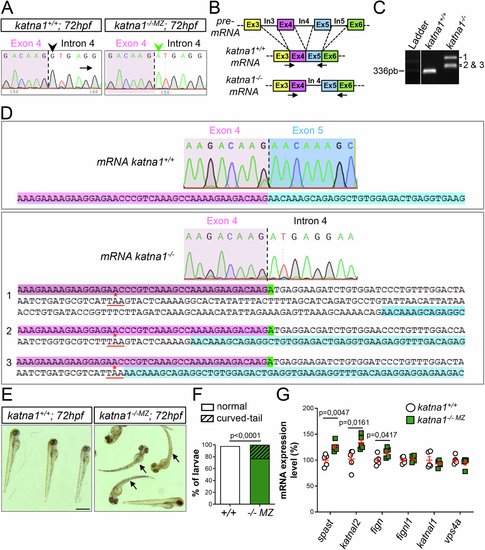
Molecular and morphological characterisation of zebrafish katna1 mutants. (A) Sequence analysis of control and katna1 mutant genomic DNA. Dotted line indicates the junction between exon 4 (pink background) and intron 4 (white background). The green arrowhead points at the nucleotide substitution (G > A) affecting the donor splice site of intron 4 (G in control, black arrowhead) in katna1 mutants. (B) Schematic representation of the RT-PCR strategy used to test the impact of the katna1 splice-site mutation on katna1 mRNA splicing. Dotted lines indicate intron splicing. Arrows represent the primers used for RT-PCR analysis. Primers were designed on exon/intron junctions to avoid contamination by genomic DNA amplification. In: intron; Ex: exon. (C) RT-PCR analysis of katna1 intron-4 splicing on total RNA extracts from katna1+/+ and katna1-/- MZ maternal zygotic mutant embryos. Homozygous katna1-/- MZ embryos lack wild-type transcript and show different populations of misspliced transcripts (1, 2 and 3). (D) Sequence analysis of katna1 misspliced transcripts. Sequences corresponding to exon 4, intron 4 and exon 5 are respectively indicated in pink, white and blue. The splice-site mutation is highlighted in green. Misspliced transcripts include various sized insertions of intron 4, which all lead to a frameshift and the occurrence of a premature stop codon at the same amino-acid position (red asterisk). (E) Gross morphology of 72-hpf control (katna1+/+) and maternal zygotic katna1 mutant (katna1-/-MZ) larvae. Arrows point at the curved-tail phenotype of some mutant larvae. Scale bar: 0.5 mm. (F) Percentage of larvae exhibiting a curved-tail phenotype. Chi2 test. (G) RT-qPCR analysis showing the differential expression levels of p60-katanin-related genes from the ATPase Meiotic Clade in control and katna1-/- MZ larvae. RNAs were extracted from 5 independent pools of 10 katna1+/+, 10 katna1-/-MZ and one pool of 10 wild-type embryos at 24 hpf. Unpaired t test. Values are shown as means ± SEM. (F, G) P values are displayed on graphs. Source data are available online for this figure. |