|
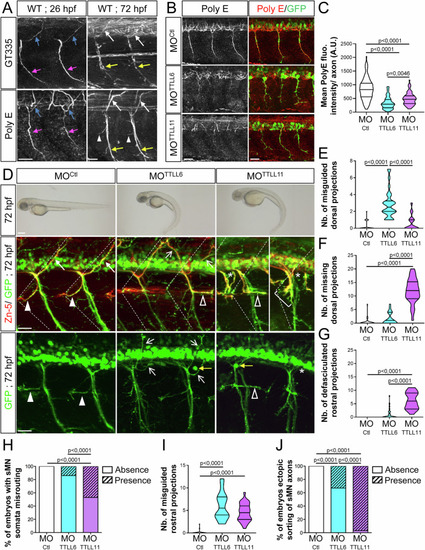
TTLL6 and TTLL11 knockdown leads to different motor axon pathfinding defects mimicking the respective phenotypes of p60-Katanin- and Spastin-depleted larvae. (A) Immunolabelling of polyglutamylated microtubules (MTs) in 26- (left panels) and 72-hpf (right panels) wild-type embryos using GT335 (upper panels) and polyE (lower panels) antibodies. Polyglutamylated MTs are observed in both pMN (26 hpf) and sMN (72 hpf) axons. Blue and pink arrows point at dorsally and ventrally projecting pMN axons, respectively. White arrows, yellow arrows and white arrowheads indicate dorsally, ventrally and rostrally projecting sMN axons, respectively. Scale bars: 25 µm. (B) Immunolabelling of polyglutamylated microtubules (MTs) in 26-hpf Tg(Hb9:GFP) embryos injected with MOCtl, MOTTLL6 or MOTTLL11 morpholinos using the polyE antibody. Scale bars: 25 µm. (C) Mean PolyE fluorescence intensity per axon (A.U.). Non-blind quantifications were conducted on MOCtl (n = 120), MOTTLL6 (n = 74) or MOTTLL11 (n = 68) pooled from two independent experiments. Twelve axons located around the yolk tube were analysed per embryo. (D) Upper panels: Overall morphology of 72-hpf control (MOCtl), TTLL6 (MOTTLL6) and TTLL1 (MOTTLL11) morphant larvae. Both TTLL6 and TTLL11 morphants exhibit a severe ventrally curved body axis phenotype compared to MOCtl-injected larvae. Scale bars: 250 μm. Middle and bottom panels: Immunolabelling of sMN axons in 72-hpf Tg(Hb9:GFP) larvae injected with MOCtl (n = 30), MOTTLL6 (n = 30) or MOTTLL11 (n = 30) larvae using Zn-5 and/or GFP antibodies. Dotted lines delineate lateral myosepta. Full arrowheads and full arrows, respectively, point at normal rostral and dorsal nerves. Empty arrowheads and empty arrows, respectively, indicate misguided rostral and dorsal projections. Brackets show defasciculated rostral nerves. Asterisks and yellow arrows, respectively, indicate the ectopic sorting of spinal motor neuron axons and somata from the spinal cord. Scale bars: 25 µm. (E–J) Quantifications of sMN defects in larvae analysed in (D). Mean number of split/misguided dorsal nerves (E), missing dorsal nerves (F), defasciculated/missing rostral nerves (G) and misrouted rostral nerves (I) per larva. (H, J) Percentage of larvae with ectopic sorting of sMN somata (H) or axons (J) from the spinal cord. Non-blind quantifications were performed on 24 spinal hemisegments located around the yolk tube per larva. Analysed larvae were pooled from three independent experiments. (C, E–G, I) Violin Plots; horizontal bars indicate the median ± the 1st and 3rd quartiles. Kruskal–Wallis ANOVA test with Dunn’s post hoc test. (H, J) Chi2 test. P values are displayed on graphs. Source data are available online for this figure.
|