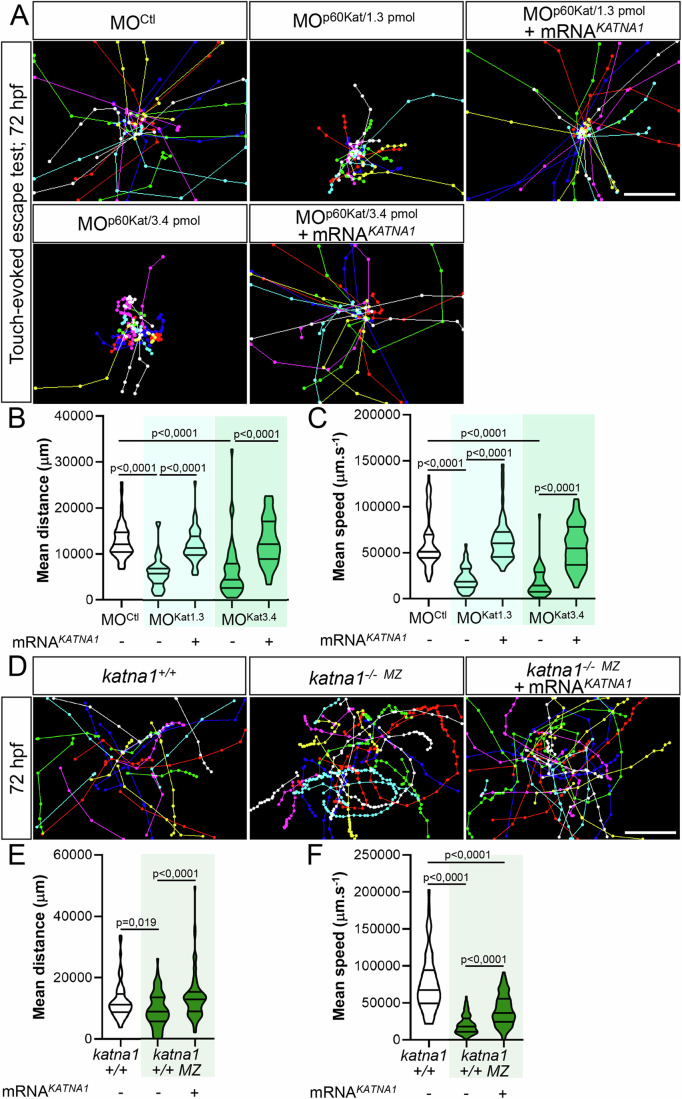
Figure 2
Loss of p60-Katanin causes a dramatic decrease in zebrafish larval mobility.
(A) Touch-evoked escape behaviour of 72-hpf larvae injected with a control morpholino (MOCtl; n = 90), increasing doses of p60-katanin morpholino (MOp60Kat/1.3pmol; n = 102 and MOp60Kat/3.4 pmol; n = 85), or co-injected with MOp60Kat morpholino and human KATNA1 mRNA (MOp60Kat/1.3pmol + mRNAKATNA1, n = 91; MOp60Kat/3.4pmol + mRNAKATNA1, n = 97). (B, C) Mean swimming distance (B) and speed (C) of the larvae tracked in (A). (D) Touch-evoked escape behaviour of 72-hpf control (katna1+/+; n = 65) and katna1 mutant larvae injected or not with human KATNA1 mRNA (katna1-/- MZ;n = 74 and katna1-/- MZ + mRNAKATNA1; n = 78) and pooled from three independent experiments. (E, F) Mean swimming distance (E) and speed (F) of the larvae tracked in (D). (A, D) Each line represents the trajectory of one larva after touch stimulation while the distance between two dots indicates the distance covered by a larva between two consecutive frames. Scale bar: 5 mm. (B, C, E, F) Violin Plots; horizontal bars indicate the median ± the 1st and 3rd quartiles. Kruskal–Wallis ANOVA test with Dunn’s post hoc test. P‐values are displayed on graphs. Source data are available online for this figure.
Acknowledgments
This image is the copyrighted work of the attributed author or publisher, and
ZFIN has permission only to display this image to its users.
Additional permissions should be obtained from the applicable author or publisher of the image.
Full text @ EMBO J.
Your Input Welcome
Thank you for submitting comments. Your input has been emailed to ZFIN curators who may contact you if
additional information is required.
Oops. Something went wrong. Please try again later.