
- Title
-
Combined effects of vitamin D3 and dioxopiperidinamide derivative on lipid homeostasis, inflammatory pathways, and redox imbalance in non-alcoholic fatty liver disease in vivo zebrafish model
- Authors
- Dharshan, S.S., Ramamurthy, K., Kaliraj, S., Manikandan, K., Chitra, V., Rajagopal, R., Alfarhan, A., Namasivayam, S.K.R., Kathiravan, M.K., Arockiaraj, J.
- Source
- Full text @ Biotechnol Appl Biochem
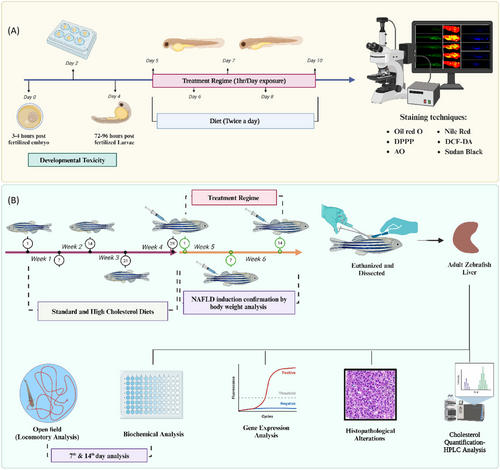
Treatment and feeding regimen of zebrafish larvae and adults. (A) Larval zebrafish feeding and treatment regimen for short-term (5 days) and experimental techniques. (B) Adult zebrafish feeding and long-term experimental regime (6 weeks) and its experimental techniques; DCFDA—2′,7-dichlorodihydrofluorescein diacetate; DPPP—diphenyl-1-pyrenylphosphine; AO—acridine orange. |
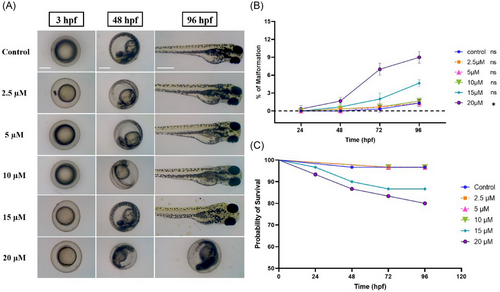
Toxicity effects of DOPA-33 compounds. The graph represents (A) the embryotoxicity of the DOPA-33 compound at various stages, such as 24, 48, and 96 hpf. (B) Percentage of malformation. (C) The survival rate of DOPA-33-exposed embryo. All the assays were conducted in triplicates as three independent experiments. hpf = hours post fertilization. Scale bar = 100 µm. |
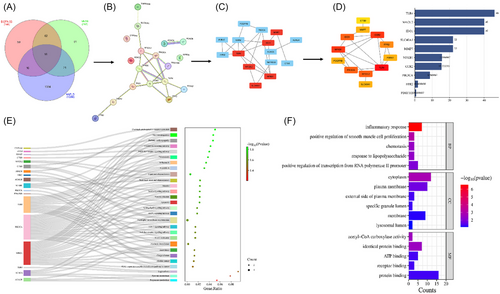
Identifying possible Vit D3 and DOPA-33 targets in NAFLD using network pharmacology. (A) Venn diagram of potential targets. (B) Protein–protein interaction (PPI) network. (C) The red nodes. (D) Top 10 hub genes ranked by degree method. (E) Bubble plot combined with Sankey diagram. (F) Histogram of GO enrichment. DOPA-33—dioxopiperidinamide-33; Vit D3—vitamin D3; NAFLD—non-alcoholic fatty liver disease. |
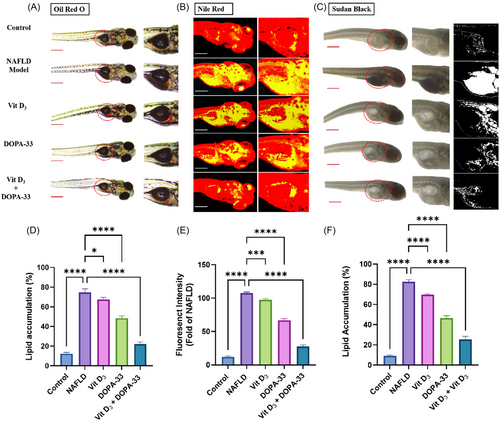
Measurement of intracellular lipids and cholesterol was stained using Oil Red O (ORO), Nile red, and Sudan Black staining (scale = 100 µm) in HCD-induced NAFLD in zebrafish larvae. The graph represents (A) ORO-stained larvae and fluorescent intensity. (B) Nile Red-stained larvae. (C) Sudan Black-stained larvae. (D) Staining intensities percentage of ORO. (E) Staining intensities fold change of Nile red. (F) Staining intensities percentages of Sudan Black. NAFLD-HCD induced larvae, Vit D3 at the concentration of 0.1 µM, DOPA-33 compound at 10 µM, Vit D3 (0.1 µM) + DOPA-33 (10 µM). All the assays were conducted in triplicates as three independent experiments. The results are presented as mean ± standard deviation (SD). The symbol * indicates a significant difference between the tested samples and the NAFLD group (*p < 0.0332; ***p < 0.0002, ****p < 0.0001). NAFLD—non-alcoholic fatty liver disease; Vit D3—vitamin D3; DOPA-33—dioxopiperidinamide-33; Vit D3 + DOPA-33—vitamin D3 + dioxopiperidinamide-33. Scale bar = 100 µm. PHENOTYPE:
|
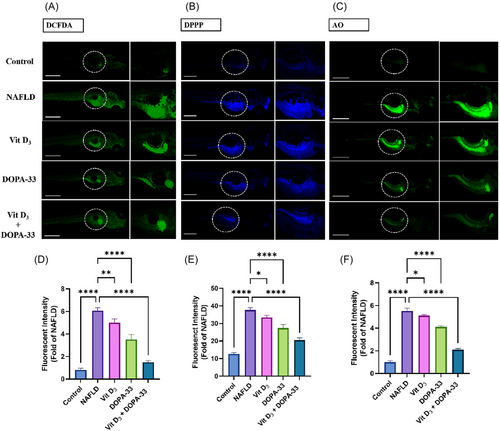
Measurement of intracellular ROS utilizing DCFH-DA, LPO assessment using DPPP, and apoptosis using AO staining in HCD-induced NAFLD in zebrafish larvae. The graph represents (A) DCFDA-stained larvae and fluorescent intensity. (B) DPPP-stained larvae. (C) AO-stained larvae. (D) Staining intensities fold change of DCFDA. (E). Staining intensities fold change of DPPP. (F) Staining intensities fold change of AO. NAFLD-HCD induced larvae, Vit D3 at the concentration of 0.1 µM, DOPA-33 compound at 10 µM, Vit D3 (0.1 µM) + DOPA-33 (10 µM). All the assays were conducted in triplicates as three independent experiments. The results are presented as mean ± standard deviation (SD). The symbol * indicates a significant difference between the tested samples and the NAFLD group (*p < 0.0332, **p < 0.0021, ****p < 0.0001). DCFDA—2′,7-dichlorodihydrofluorescein diacetate; DPPP—diphenyl-1-pyrenylphosphine; AO—acridine orange; NAFLD—non-alcoholic fatty liver disease; Vit D3—vitamin D3; DOPA-33—dioxopiperidinamide-33; Vit D3 + DOPA-33—vitamin D3 + dioxopiperidinamide-33. Scale bar = 100 µm. PHENOTYPE:
|
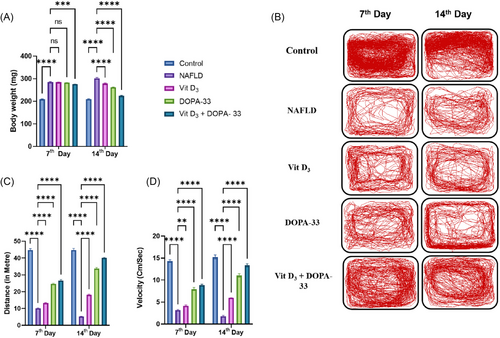
Locomotion activity of NAFLD-induced adult zebrafish. The graph represents (A) Bodyweight. (B) The movement of NAFLD and treatment fish. (C) The distance traveled. (D) Velocity. NAFLD-HCD induced larvae, Vit D3 at the concentration of 0.1 µM, DOPA-33 compound at 10 µM, Vit D3 (0.1 µM) + DOPA-33 (10 µM). All the assays were conducted in triplicates as three independent experiments. The results are presented as mean ± standard deviation (SD). The symbol * indicates a significant difference between the tested samples and the NAFLD group (**p < 0.0021, ***p < 0.0002, ****p < 0.0001, and ns = not significant). NAFLD—non-alcoholic fatty liver disease; Vit D3—vitamin D3; DOPA-33—dioxopiperidinamide-33; Vit D3 + DOPA-33—vitamin D3 + dioxopiperidinamide-33. PHENOTYPE:
|
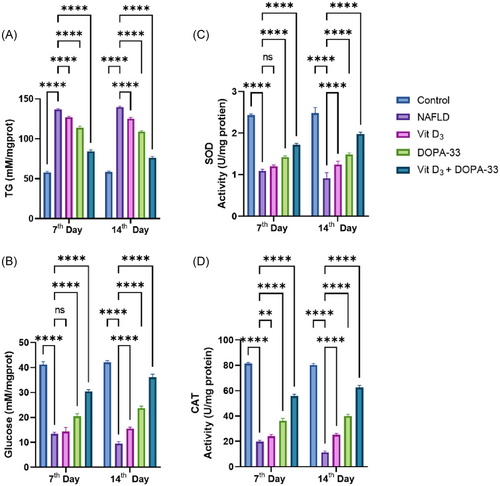
Biochemical estimations were conducted by assessing the TG, glucose, SOD, and CAT in NAFLD-induced adult zebrafish liver. The graph represents (A) the amount of TG in mM/mg. (B) The relative percentages of glucose. (C) SOD activity in U/mg. (D) CAT activity in U/mg. NAFLD-HCD induced larvae, Vit D3 at the concentration of 0.1 µM, DOPA-33 compound at 10 µM, Vit D3 (0.1 µM) + DOPA-33 (10 µM). All the assays were conducted in triplicates as three independent experiments. The results are presented as mean ± standard deviation (SD). The symbol * indicates a significant difference between the tested samples and the NAFLD group (**p < 0.0021, ****p < 0.0001, and ns = not significant). TG—triglycerides; SOD—superoxide dismutase; CAT—catalase; NAFLD—non-alcoholic fatty liver disease; Vit D3—vitamin D3; DOPA-33—dioxopiperidinamide-33; Vit D3 + DOPA-33—vitamin D3 + dioxopiperidinamide-33. PHENOTYPE:
|
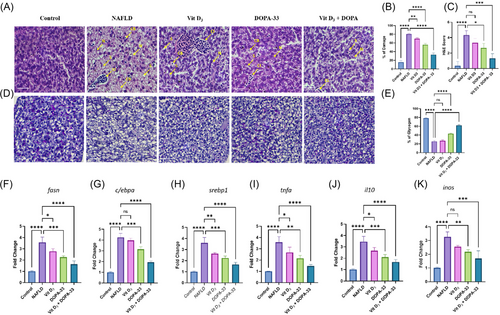
Histology analysis of liver section using H&E staining in HCD-induced zebrafish adult. The graph represents (A) the H&E-stained liver section. (B) The percentage of cell damage in the liver section. (C) H&E scores in the liver section. (D) PAS staining of liver section. (E) Percentage of glycogen accumulation. Gene expression of HCD-induced NAFLD-induced adult zebrafish, (F) fasn. (G) c/ebpa. (H) srebp1. (I) tnf-α. (J) il-10. (K) inos. Vit D3 at the concentration of 0.1 µM, DOPA-33 compound at 10 µM, Vit D3 (0.1 µM) + DOPA-33 (10 µM). All the assays were conducted in triplicates as three independent experiments. The results are presented as mean ± standard deviation (SD). The symbol * indicates a significant difference between the tested samples and the NAFLD group (*p < 0.0332, **p < 0.0021, ***p < 0.0002, ****p < 0.0001, and ns = not significant). H&E—hematoxylin and eosin; N—necrosis; S—steatosis; CI—cellular infiltration; CB—cellular ballooning; PAS—periodic acid–Schiff; fasn—fatty acid synthase; c/ebpa—CCAAT/enhancer binding protein alpha; srebp1—sterol regulatory element-binding protein 1; il-10—interleukin 10; tnfa—tumor necrosis factor alpha; inos—inducible nitric oxide synthase; NAFLD—non-alcoholic fatty liver disease; Vit D3—vitamin D3; DOPA-33—dioxopiperidinamide-33; Vit D3 + DOPA-33—vitamin D3 + dioxopiperidinamide-33. Scale bar = 20 µm. |
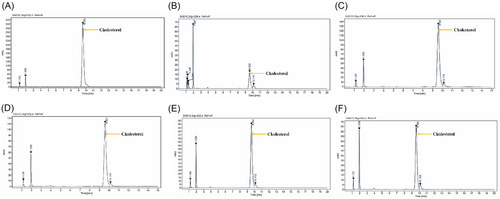
Amount of cholesterol presented in HCD-induced NAFLD in both treatment and exposed zebrafish liver using HPLC-UV. The graph represents the cholesterol peak of standard and samples: (A) Standard, which shows a retention time of 9.553; (B) Control group, which shows a retention time of 9.565; (C) HCD-induced NAFLD, which shows a retention time of 9.557. (D) Samples of the Vit D3-treated group at 0.1 µM, which shows a retention time of 9.561. (E) DOPA-33-treated groups at the concentration of 10 µM show a retention time 9.557. (F) Vit D3 + DOPA-33-treated group exhibits retention time within the range of 9.558. PHENOTYPE:
|