
|
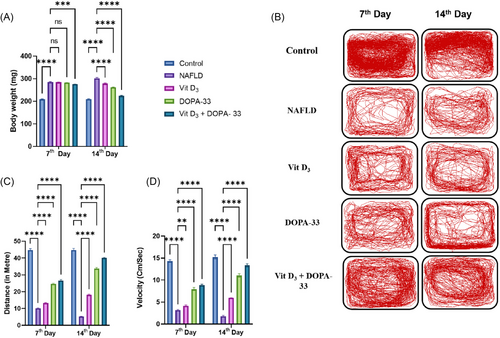
Fig. 6 Locomotion activity of NAFLD-induced adult zebrafish. The graph represents (A) Bodyweight. (B) The movement of NAFLD and treatment fish. (C) The distance traveled. (D) Velocity. NAFLD-HCD induced larvae, Vit D3 at the concentration of 0.1 µM, DOPA-33 compound at 10 µM, Vit D3 (0.1 µM) + DOPA-33 (10 µM). All the assays were conducted in triplicates as three independent experiments. The results are presented as mean ± standard deviation (SD). The symbol * indicates a significant difference between the tested samples and the NAFLD group (**p < 0.0021, ***p < 0.0002, ****p < 0.0001, and ns = not significant). NAFLD—non-alcoholic fatty liver disease; Vit D3—vitamin D3; DOPA-33—dioxopiperidinamide-33; Vit D3 + DOPA-33—vitamin D3 + dioxopiperidinamide-33.