|
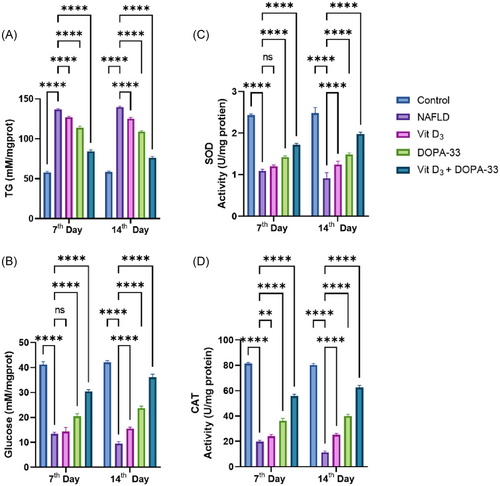
Biochemical estimations were conducted by assessing the TG, glucose, SOD, and CAT in NAFLD-induced adult zebrafish liver. The graph represents (A) the amount of TG in mM/mg. (B) The relative percentages of glucose. (C) SOD activity in U/mg. (D) CAT activity in U/mg. NAFLD-HCD induced larvae, Vit D3 at the concentration of 0.1 µM, DOPA-33 compound at 10 µM, Vit D3 (0.1 µM) + DOPA-33 (10 µM). All the assays were conducted in triplicates as three independent experiments. The results are presented as mean ± standard deviation (SD). The symbol * indicates a significant difference between the tested samples and the NAFLD group (**p < 0.0021, ****p < 0.0001, and ns = not significant). TG—triglycerides; SOD—superoxide dismutase; CAT—catalase; NAFLD—non-alcoholic fatty liver disease; Vit D3—vitamin D3; DOPA-33—dioxopiperidinamide-33; Vit D3 + DOPA-33—vitamin D3 + dioxopiperidinamide-33.
|