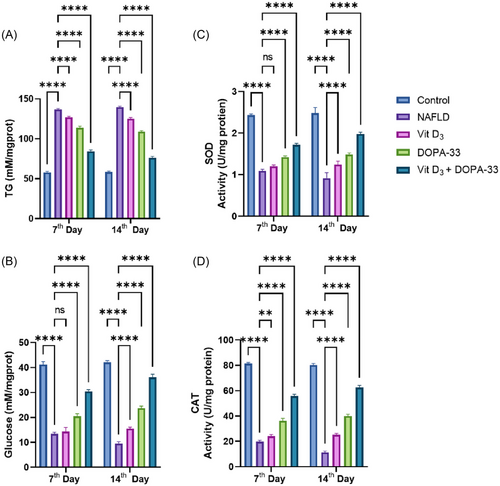
Fig. 7 Biochemical estimations were conducted by assessing the TG, glucose, SOD, and CAT in NAFLD-induced adult zebrafish liver. The graph represents (A) the amount of TG in mM/mg. (B) The relative percentages of glucose. (C) SOD activity in U/mg. (D) CAT activity in U/mg. NAFLD-HCD induced larvae, Vit D3 at the concentration of 0.1 µM, DOPA-33 compound at 10 µM, Vit D3 (0.1 µM) + DOPA-33 (10 µM). All the assays were conducted in triplicates as three independent experiments. The results are presented as mean ± standard deviation (SD). The symbol * indicates a significant difference between the tested samples and the NAFLD group (**p < 0.0021, ****p < 0.0001, and ns = not significant). TG—triglycerides; SOD—superoxide dismutase; CAT—catalase; NAFLD—non-alcoholic fatty liver disease; Vit D3—vitamin D3; DOPA-33—dioxopiperidinamide-33; Vit D3 + DOPA-33—vitamin D3 + dioxopiperidinamide-33.
Image
Figure Caption
Figure Data
Acknowledgments
This image is the copyrighted work of the attributed author or publisher, and
ZFIN has permission only to display this image to its users.
Additional permissions should be obtained from the applicable author or publisher of the image.
Full text @ Biotechnol Appl Biochem

