
Image
|
Figure Caption
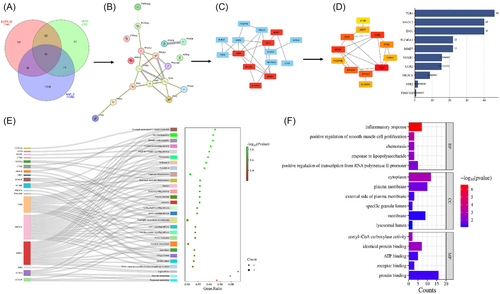
Fig. 3 Identifying possible Vit D3 and DOPA-33 targets in NAFLD using network pharmacology. (A) Venn diagram of potential targets. (B) Protein–protein interaction (PPI) network. (C) The red nodes. (D) Top 10 hub genes ranked by degree method. (E) Bubble plot combined with Sankey diagram. (F) Histogram of GO enrichment. DOPA-33—dioxopiperidinamide-33; Vit D3—vitamin D3; NAFLD—non-alcoholic fatty liver disease.
Acknowledgments
This image is the copyrighted work of the attributed author or publisher, and
ZFIN has permission only to display this image to its users.
Additional permissions should be obtained from the applicable author or publisher of the image.
Full text @ Biotechnol Appl Biochem