
|
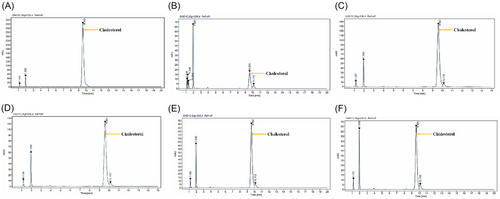
Fig. 9 Amount of cholesterol presented in HCD-induced NAFLD in both treatment and exposed zebrafish liver using HPLC-UV. The graph represents the cholesterol peak of standard and samples: (A) Standard, which shows a retention time of 9.553; (B) Control group, which shows a retention time of 9.565; (C) HCD-induced NAFLD, which shows a retention time of 9.557. (D) Samples of the Vit D3-treated group at 0.1 µM, which shows a retention time of 9.561. (E) DOPA-33-treated groups at the concentration of 10 µM show a retention time 9.557. (F) Vit D3 + DOPA-33-treated group exhibits retention time within the range of 9.558.