
|
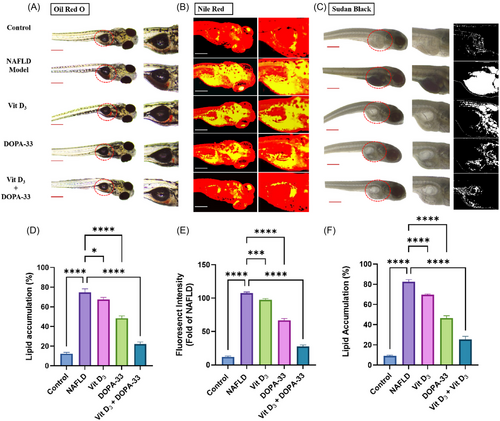
Fig. 4 Measurement of intracellular lipids and cholesterol was stained using Oil Red O (ORO), Nile red, and Sudan Black staining (scale = 100 µm) in HCD-induced NAFLD in zebrafish larvae. The graph represents (A) ORO-stained larvae and fluorescent intensity. (B) Nile Red-stained larvae. (C) Sudan Black-stained larvae. (D) Staining intensities percentage of ORO. (E) Staining intensities fold change of Nile red. (F) Staining intensities percentages of Sudan Black. NAFLD-HCD induced larvae, Vit D3 at the concentration of 0.1 µM, DOPA-33 compound at 10 µM, Vit D3 (0.1 µM) + DOPA-33 (10 µM). All the assays were conducted in triplicates as three independent experiments. The results are presented as mean ± standard deviation (SD). The symbol * indicates a significant difference between the tested samples and the NAFLD group (*p < 0.0332; ***p < 0.0002, ****p < 0.0001). NAFLD—non-alcoholic fatty liver disease; Vit D3—vitamin D3; DOPA-33—dioxopiperidinamide-33; Vit D3 + DOPA-33—vitamin D3 + dioxopiperidinamide-33. Scale bar = 100 µm.