
- Title
-
The myocardium utilizes a platelet-derived growth factor receptor alpha (Pdgfra) - phosphoinositide 3-kinase (PI3K) signaling cascade to steer towards the midline during zebrafish heart tube formation
- Authors
- Shrestha, R., McCann, T., Saravanan, H., Lieberth, J., Koirala, P., Bloomekatz, J.
- Source
- Full text @ Elife
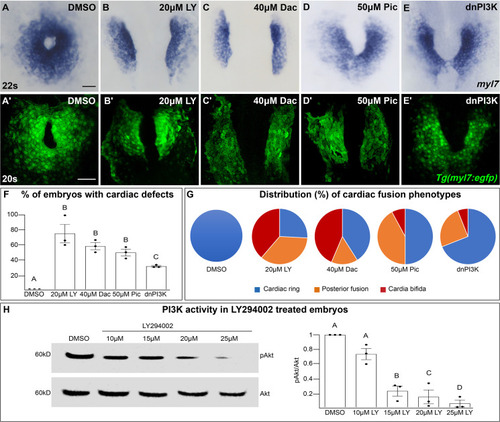
The phosphoinositide 3-kinase (PI3K) pathway is required for cardiac fusion. Dorsal views, anterior to the top, of the myocardium labeled with myl7 (A–E) at 22 somite stage (s) or Tg(myl7:egfp) (A'–E') at 20s. In contrast to a ring of myocardial cells in DMSO-treated embryos (A, A'), in embryos treated with PI3K inhibitors LY294002 (LY, B, B'), Dactolisib (Dac, C, C'), or Pictilisib (Pic, D, D') at bud stage or injected with dnPI3K mRNA (750 pg) at the one-cell stage (E, E') cardiac fusion fails to occur properly with embryos displaying either cardia bifida (B, C) or fusion only at the posterior end (D, E). Graphs depict the percentage (F) and range (G) of cardiac fusion defects in control and PI3K-inhibited embryos. Dots represent the percent of embryos with cardiac defects per biological replicate. Total embryos analyzed n = 37 (DMSO), 31 (20 μM LY), 39 (40 μM Dac), 38 (50 μM Pic), and 86 (dnPI3K). Blue – cardiac ring/normal; orange – fusion only at posterior end/mild phenotype, red – cardia bifida/severe phenotype. (H) Representative immunoblot and ratiometric analysis of phosphorylated Akt (pAkt) to Akt protein levels in DMSO- and LY-treated embryos reveals a dose-dependent decrease in PI3K activation. Bar graphs indicate mean ± standard error of the mean (SEM), dots indicate pAKT/AKT ratio per biological replicate, normalized to DMSO. Three biological replicates per treatment. One-way analysis of variance (ANOVA) tests – letter changes indicate differences of p < 0.05 (F, H). Scale bars, 40 μm (A–E), 42 μm (A'–E'). Raw data and full p-values included in the source file. |
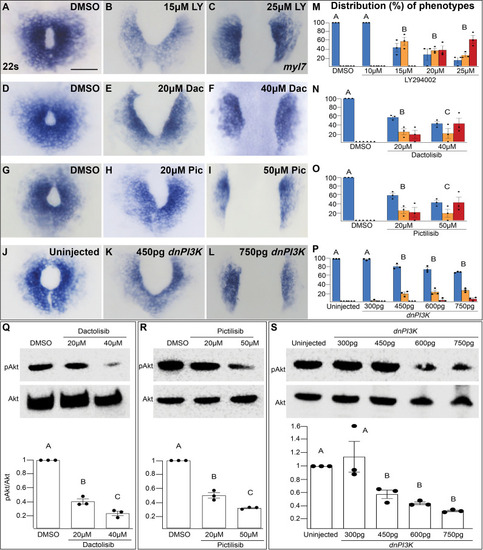
The penetrance and severity of cardiac fusion defects in phosphoinositide 3-kinase (PI3K)-inhibited embryos is dose dependent. (A–L) myl7 insitus labeling the myocardium at 22s. Incubation with LY (A–C), Dac (D–F), Pic (G–I) from bud stage to 22s or injection with dnPI3K mRNA (J–L) at the one-cell stage results in dose-dependent cardiac fusion defects at 22s. Graphs depict the distribution of cardiac fusion defects in embryos treated with increasing concentrations of LY (M), Dac (N), Pic (O), or dnPI3K mRNA (P). Both the percent of embryos displaying cardiac fusion defects and the severity of those defects are dose dependent. Number of embryos analyzed (n) at the indicated concentrations in (M–P) LY-40, 40, 30, 31, 31; Dac: 38, 34, 39; Pic: 37, 39, 38; dnPI3K mRNA: 73, 52, 61, 57, 52, respectively. Dots indicate the percent of embryos displaying a specific phenotype per incubation. Blue – cardiac ring/normal; orange – fusion only at posterior end/mild, red – cardia bifida/severe. Bar graphs, mean ± standard error. Representative immunoblot and ratiometric analysis of phosphorylated Akt (pAkt) to Akt protein levels in DMSO and Dac (Q), Pic (R), and dnPI3K mRNA (S) treated embryos reveals a dose-dependent decrease in PI3K activation. Bar graphs indicate mean ± standard error, dots indicate pAKT/AKT ratio per biological replicate, normalized to DMSO. At least three biological replicates per treatment. Letter change indicates p < 0.05, one-way analysis of variance (ANOVA). Scale = 60 μm. Raw data with full p-values included in the source file. |
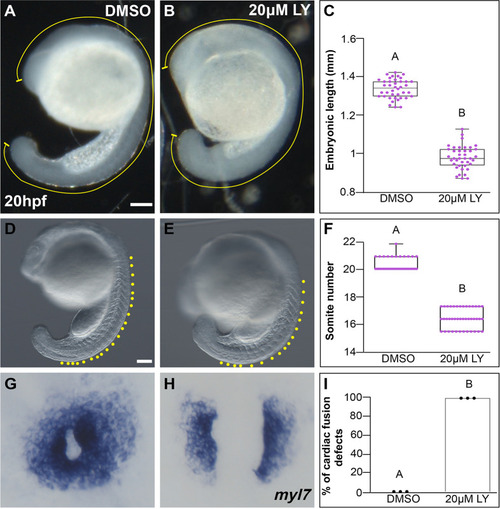
LY incubation results in trunk extension and somite formation delays. Lateral brightfield views of 20 hours post-fertilization (hpf) embryos treated with DMSO ( |
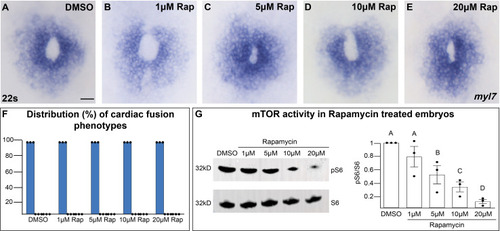
Inhibition of mTOR activity does not affect cardiac fusion. (A–E) Myocardium visualized with myl7 expression at 22s in embryos treated at bud stage with increasing concentrations of rapamycin (Rap), an inhibitor of mTOR activity. (F) Bar graph displays the distribution of cardiac phenotypes at each rapamycin concentration from three replicates. Total number of embryos analyzed n = 45, 46, 45, 45, 44, respectively. Blue bar = cardiac ring/normal; scale bar = 40 μm. All embryos display cardiac rings, indicating normal cardiac fusion. (G) Representative immunoblot and ratiometric analysis of phosphorylated ribosomal protein S6 (pS6) – a read-out of mTOR activity, to S6 levels reveals that mTOR activity decreases with increasing concentrations of rapamycin. Letter change indicates p < 0.05, one-way analysis of variance (ANOVA). Raw data with full p-values included in the source file. |
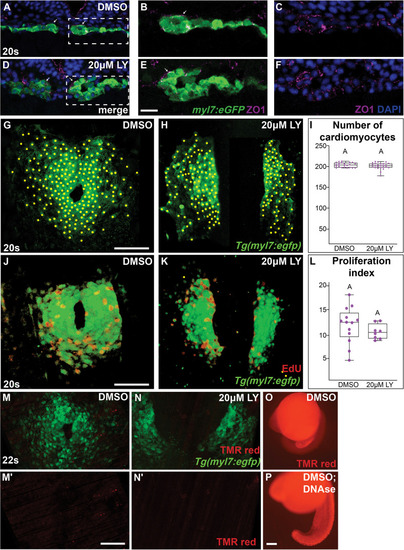
Morphology and proliferation in the myocardium are not compromised in phosphoinositide 3-kinase (PI3K)-inhibited embryos. Representative transverse cryosections, dorsal to the top, compare the morphology of the myocardium, visualized with |
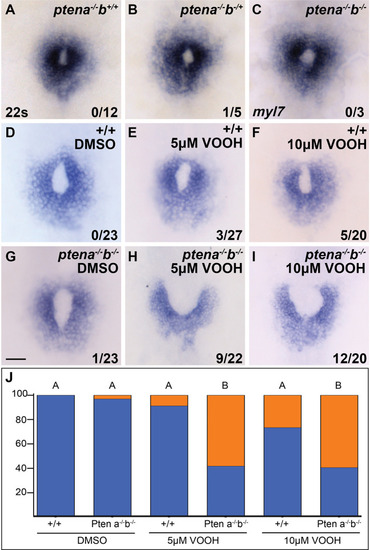
Loss of Pten, an antagonist of phosphoinositide 3-kinase (PI3K) activity, causes cardiac fusion defects. ( |
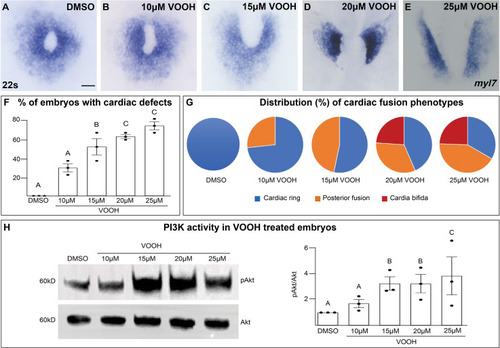
Inhibition of Pten activity with VO-OHpic increases pAkt and causes cardiac fusion defects. (A–G) Dorsal views of the myocardium labeled with myl7 at 22s in embryos incubated with increasing concentrations of the Pten inhibitor VO-OHpic (VO-OH) from bud stage to 22s. Graphs depicting the average % of embryos displaying cardiac fusion defects (F) and the distribution of cardiac fusion phenotypes (G). Blue – cardiac ring/normal; orange – fusion only at posterior end/mild phenotype, red – cardia bifida/severe phenotype. (H) Representative immunoblot and graph of ratiometric analysis of pAKT to AKT protein levels indicates increasing pAKT levels with increasing concentrations of the Pten inhibitor VO-OH. Three separate incubations per concentration (dots in F, H). n = 15 embryos per incubation per concentration (A–G). Letter change indicates p < 0.05, one-way analysis of variance (ANOVA). Raw data and full p-values included in the source file. |
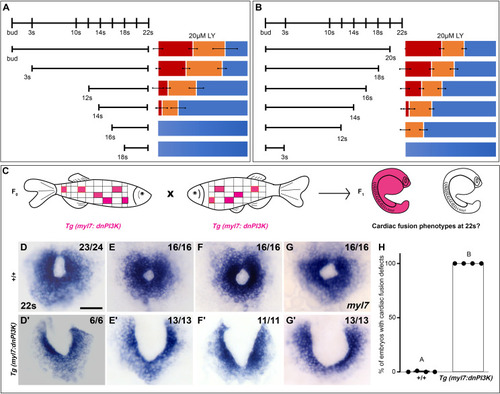
Phosphoinositide 3-kinase (PI3K) is required in the myocardium throughout cardiac fusion. Graphical representation of the PI3K inhibitor addition (A) and wash-out (B) experiments used to determine the developmental stage over which PI3K is required. In (A) LY is added to embryos at different developmental stages and incubated until 22s, when cardiac fusion is assessed. In (B), LY is added at bud stage and washed-out at different developmental stages, after which embryos are incubated in normal media till 22s, when cardiac fusion is assessed. Bar graphs indicate the average proportion of embryos displaying different phenotypes. Blue – cardiac ring/normal; orange – fusion only at posterior end/mild phenotype, red – cardia bifida/severe phenotype. n = 45 embryos per treatment condition from three biological replicates. (C) Schematic outlines experimental design to test requirement for PI3K in the myocardium. Pink – cells with the Tg(myl7:dnPI3K) transgene. F0 animals are mosaic for the transgene, while all cells in F1 embryos either have the transgene (pink) or do not (white). The myl7 promoter restricts dnPI3K expression to the myocardium in Tg(myl7:dnPI3K) embryos. (D–G) Dorsal view of the myocardium labeled with myl7 in embryos at 22s from four different founder pairs (D–D', E–E', F–F', G–G'). F1 embryos without the Tg(myl7:dnPI3K) transgene (as determined by genotyping) display normal cardiac fusion (D–G, n = 23/24, 16/16, 16/16, 16/16, per founder pair), while F1 siblings with the Tg(myl7:dnPI3K) transgene display cardiac fusion defects (D'–G', n = 6/6, 13/13, 11/11, 13/13), indicating that PI3K signaling is required in myocardial cells. (H) Graph indicating the average % of wild-type and Tg(myl7:dnPI3K)+ embryos with cardiac fusion defects. Letter difference indicates a significant Fisher’s exact test, p = 5.56 × 10⁻³¹. Scale bar, 40 μm. |
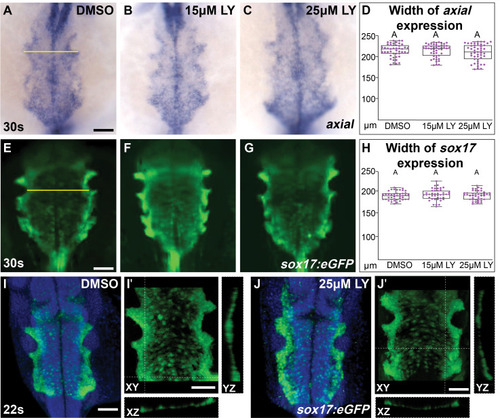
The morphology of endoderm is not compromised in phosphoinositide 3-kinase (PI3K)-inhibited embryos. Dorsal views, anterior to the top, of the anterior endoderm labeled with |
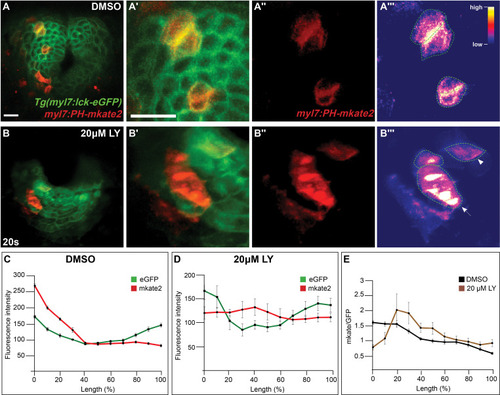
Phosphoinositide 3-kinase (PI3K) activity in myocardial cells. ( |
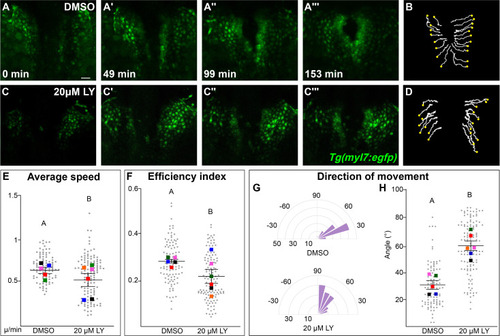
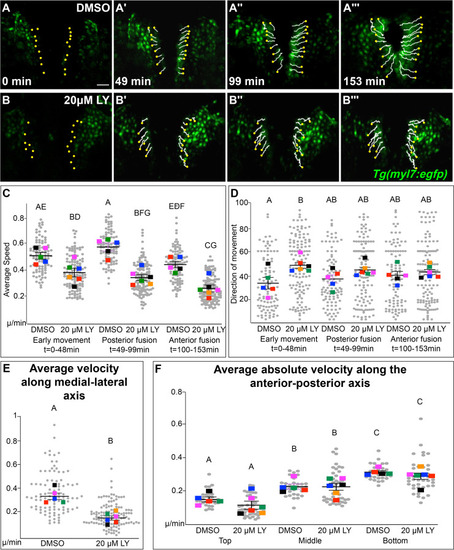
Phosphoinositide 3-kinase (PI3K) signaling regulates the medial movement and speed of the myocardium during cardiac fusion. Time points from a representative video of myocardial cells visualized with the Tg(myl7:egfp) transgene in embryos treated with DMSO (A, B, Figure 3—video 1) or 20 μM LY (C, D, Figure 3—video 2) from bud stage to 22s. 3D reconstructions of confocal slices (A, C) reveal changes in conformation and location of the myocardium at three major stages of cardiac fusion: early medial movement toward the embryonic midline (A–A', C–C'), posterior merging of bilateral populations (A'', C'') and anterior merging to form a ring (A''', C'''). Representative tracks (B, D) show the paths of a subset of myocardial cells over ~2.5 hr. Yellow dots indicate the starting point of each track. Graphs depict average speed (E), efficiency index (F), and angle of movement (G, H) of myocardial cells. Angular movement along the anterior–posterior axis does not distinguish anterior from posterior movement (G, H). Myocardial cells in PI3K-inhibited embryos show an overall direction of movement that is angular (60–90°) and is slower than in DMSO-treated embryos. 96 and 125 cells were analyzed from five DMSO- and six 20 μM LY-treated embryos, respectively. Gray dots – individual cells; color squares – average per embryo. Average of embryos and standard error (shown in E, F, H). Two-sample t-test, letter change indicates p < 0.05. Scale bars, 60 μm. Quantification details in the methods. Raw data and full p-values included in the source file. |
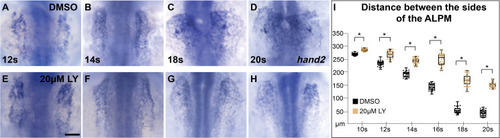
Myocardial movement toward the midline is disrupted in phosphoinositide 3-kinase (PI3K)-inhibited embryos throughout cardiac fusion. Dorsal views, anterior to the top, of embryos displaying the expression of |
Phosphoinositide 3-kinase (PI3K) signaling directs myocardial movement during the early stages of cardiac fusion and regulates velocity along the medial-lateral axis. ( |
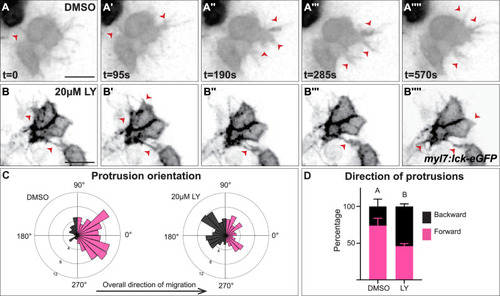
Myocardial membrane protrusions are misdirected in phosphoinositide 3-kinase (PI3K)-inhibited embryos. (A–B'''') timepoints from representative videos (see Figure 4—video 1) of myocardial cells whose membrane has been labeled with myl7:lck-eGFP (black), medial to the right, in a DMSO- (A–A'''') or a 20 μM LY- (B–B'''') treated embryo. Red arrowheads indicate representative protrusions, which are mostly oriented medially, coincident with the direction of movement in DMSO-treated embryos (A–A'''') but are oriented in all directions in LY-treated embryos (B–B''''). Rose (C) and bar (D) graphs displaying the orientation of membrane protrusions in DMSO- (left) or LY- (right) treated embryos. The length of each radial bar in (C) represents the percentage of protrusions in each bin. Bar graph displays the total percentage of forward or backward protrusions. Forward protrusions: 270–90°, pink. Backward protrusions: 90–270°, black. n = 425 protrusions from 11 cells in 5 embryos (DMSO), and 480 protrusions from 11 cells in 4 embryos (20 μM LY). Fisher’s exact test, p-value 1.8 × 10⁻⁵. Mean ± standard error. Scale bar, 30 μm. Raw data included in the source file. |
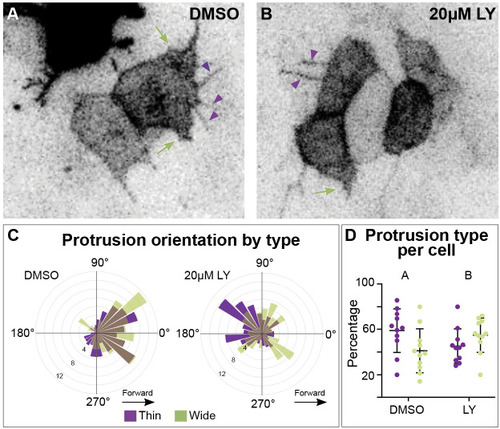
Different types of myocardial protrusion morphologies occur during cardiac fusion. Snapshots from timelapse videos of myocardial cells mosaically labeled with |
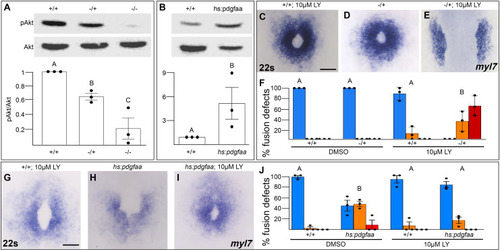
Pdgfra activates and genetically interacts with phosphoinositide 3-kinase (PI3K) signaling to regulate cardiac fusion. (A, B) Immunoblot and ratiometric analysis of phosphorylated Akt (pAkt) compared to total Akt levels reveals reduced pAkt levels in loss-of-function pdgfrask16 heterozygous (−/+) or homozygous (−/−) mutant embryos at 22s (A), and elevated pAkt levels at 22s when PDGF signaling is activated with the Tg(hs:pdgfaa) transgene (B). Bar graphs display averages from three separate experiments. (C–E, G–I) Dorsal views, anterior to the top, of the myocardium labeled with myl7 at 22s. In contrast to a normal ring of myocardial cells found in wild-type embryos treated with 10 μM LY starting at bud stage (C) or in pdgfra heterozygous embryos (D), when pdgfra heterozygous mutants are exposed to 10 μM LY, cardiac fusion is defective with embryos displaying severe phenotypes such as cardia bifida (E). Furthermore, the percent of cardiac fusion defects observed in Tg(hs:pdgfaa) embryos heat-shocked at bud stage (H) is greatly decreased when heat-shocked Tg(hs:pdgfaa) embryos are exposed to 10 μM LY at bud stage (I). (F, J) Bar graphs depict the average distribution of cardiac fusion defects from the indicated genotypes. The total number of embryos examined over three separate replicates are 47 (DMSO, +/+), 25 (DMSO, −/+), 36 (10 μM LY, +/+), 31 (10 μM LY, −/+), 49 (heat-shock, DMSO, +/+), 57 (heat-shock, DMSO, Tg(hs:pdgfaa)), 51 (heat-shock, 10 μM LY, +/+), 57 (heat-shock, 10 μM LY, Tg(hs:pdgfaa)). Blue – cardiac ring/normal; orange – fusion only at posterior end/mild, red – cardia bifida/severe. Bar graphs, mean ± standard error. One-way analysis of variance (ANOVA) (A, F, J) or Student’s t-test (B), letter change indicates p < 0.05. Scale bar, 60 μm. Raw data and full p-values included in the source file. |