FIGURE

Figure 2—figure supplement 1

ID
ZDB-FIG-231116-89
Publication
Shrestha et al., 2023 - The myocardium utilizes a platelet-derived growth factor receptor alpha (Pdgfra) - phosphoinositide 3-kinase (PI3K) signaling cascade to steer towards the midline during zebrafish heart tube formation
Other Figures
All Figure Page
Back to All Figure Page
Figure 2—figure supplement 1

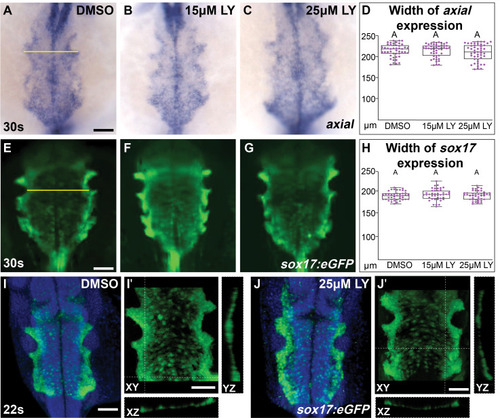
The morphology of endoderm is not compromised in phosphoinositide 3-kinase (PI3K)-inhibited embryos.

Dorsal views, anterior to the top, of the anterior endoderm labeled with axial (A–C) or the Tg(sox17:eGFP) transgene (E–J) at 30s (A–G) or 22s (I, J). Embryos incubated with either DMSO (A, E, I), 15 μM LY (B, F), or 25 μM LY (C, G, J) from the bud stage to 30s (A–H) or 22s (I–J) show no observable difference in the appearance or width of the anterior endoderm. Box-whisker plots display median width of the anterior endoderm from D, H, respectively. n = 47 (axial) and 42 (Tg(sox17:egfp)) embryos per inhibitor concentration from three separate incubations. Yellow lines: width of the endodermal sheet. Purple dots (D, H) indicate individual embryos. No letter differences indicate p-value >0.05 as tested by one-way analysis of variance (ANOVA). High-resolution confocal images of the endoderm at 22s (I, J) further reveals no changes in continuity of the endoderm layer. Three-dimensional reconstructions of the anterior endoderm in DMSO- and 25 μM LY-treated embryos (I, J). Magnifications of I, J with XZ and YZ transverse slices (I’, J’). Tg(sox17:eGFP) transgene = green, blue = DAPI. Scale bars, 60 (A–C), 50 (E–G), 70.6 (I, J) μm. Raw data and full p-values included in the source file.

Expression Data

Expression Detail
Antibody Labeling
Phenotype Data

Phenotype Detail
Acknowledgments
This image is the copyrighted work of the attributed author or publisher, and ZFIN has permission only to display this image to its users. Additional permissions should be obtained from the applicable author or publisher of the image. Full text @ Elife