Image
Figure Caption

Figure 4—figure supplement 1 Different types of myocardial protrusion morphologies occur during cardiac fusion.

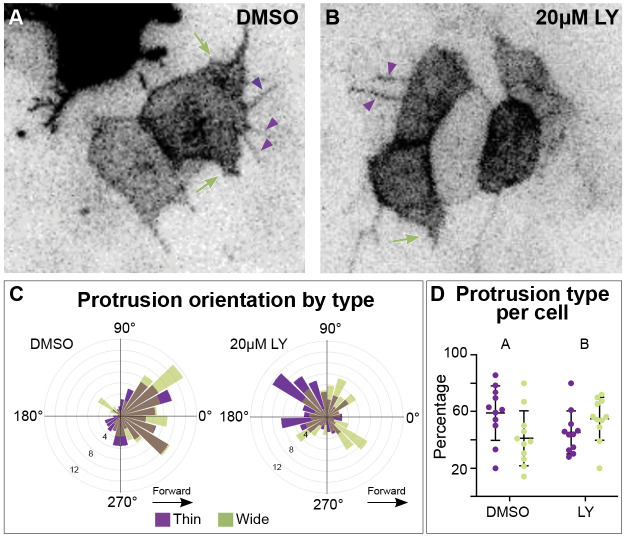
Snapshots from timelapse videos of myocardial cells mosaically labeled with myl7:lck-eGFP in a DMSO- (A) or a LY- (B) treated embryo. Purple arrowheads and green arrows indicate thin and wide protrusions, respectively. (C) Rose plots display the orientation of thin and wide protrusions in DMSO- (left) or LY- (right) treated embryos. Forward/medial direction: 270–90°. Backward/lateral direction: 90–270°. (D) Graphs indicate the average percentage of thin (purple dots) or wide (green dots) protrusions per cell per hour. Dots = individual cells. n = 425 protrusions from 11 cells in 5 embryos (DMSO), and 480 protrusions from 11 cells in 4 embryos (20 µM LY). Fisher’s exact test, p-value 3.866e-08. Mean ± standard deviation. Raw data included in the source file.

Acknowledgments
This image is the copyrighted work of the attributed author or publisher, and ZFIN has permission only to display this image to its users. Additional permissions should be obtained from the applicable author or publisher of the image. Full text @ Elife