Image
Figure Caption

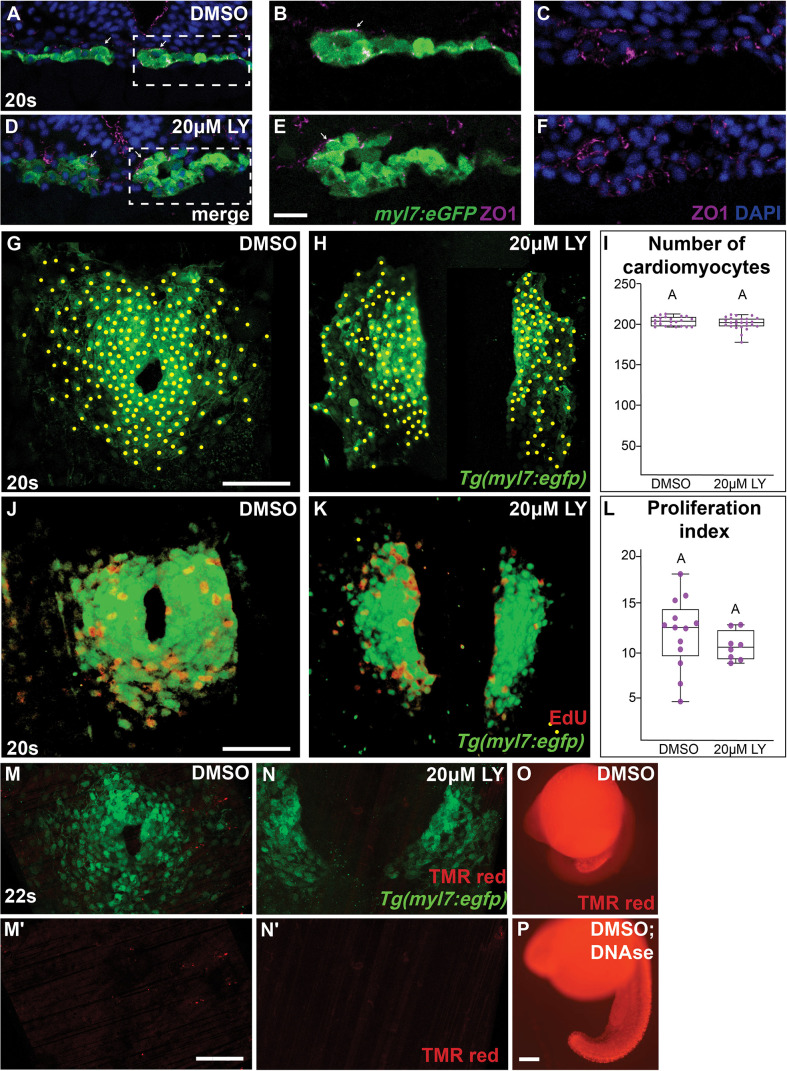
Figure 1—figure supplement 4 Morphology and proliferation in the myocardium are not compromised in phosphoinositide 3-kinase (PI3K)-inhibited embryos.

Representative transverse cryosections, dorsal to the top, compare the morphology of the myocardium, visualized with Tg(myl7:eGFP) (green), ZO1 (purple), and 4’,6-diamidino-2-phenylindole (DAPI, blue) between DMSO- (A–C) and 20 μM LY- (D–F) treated (bud stage to 20s) embryos. Box (A, D) indicates region magnified in (B, C, E, F). Arrows indicate second dorsal layer. (G–I) Representative images of the myocardium at 20s, which were used to count myocardial cells in DMSO- (G) or 20 μM LY- (H) treated embryos. Yellow dots indicate individual myocardial cells counted using ImageJ. Box-whisker plot displays median number of myocardial cells (I). (J–L) EdU incorporation into the myocardium at 20s in DMSO- (J) and LY- (K) treated embryos following a 1-hr pulse of EdU at 16s. Box-whisker plot displays median proliferation index (L). (M–P) TUNEL staining of Tg(myl7:eGFP) DMSO- and LY-treated embryos (M, N). TUNEL (TMR-red) only channel (M', N'). DMSO only or DMSO and DNAse-treated embryos (O, P). There was no difference in percent of TUNEL+ cardiomyocytes between DMSO- and LY-treated embryos (quantification in source file). n = 21, 25, 13, 8, 17, 19 embryos from 2 to 4 separate bud stage to 20s incubations from (G, H, J, K, M, N), respectively. Scale bars: 10 (A–F), 24 (G, H), 50 (J, K), 60 (M, N), and 10 (O, P) μm. No letter change indicates p > 0.05, two-sample t-test. Raw data and full p-values included in the source file.

Acknowledgments
This image is the copyrighted work of the attributed author or publisher, and ZFIN has permission only to display this image to its users. Additional permissions should be obtained from the applicable author or publisher of the image. Full text @ Elife