
- Title
-
Allosteric inhibition of muscle-type nicotinic acetylcholine receptors by a neuromuscular blocking agent pancuronium
- Authors
- Sakata, S., Ono, F.
- Source
- Full text @ PLoS One
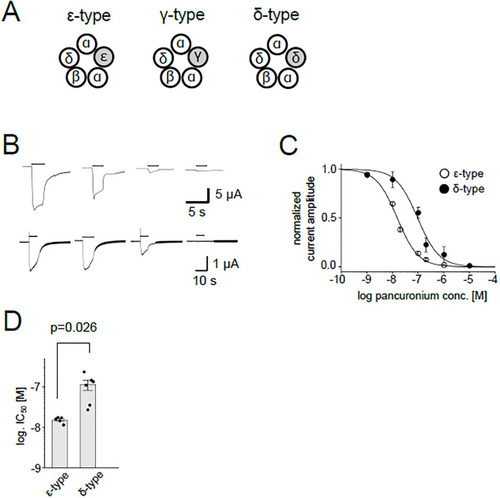
Inhibition of the nAChR current by pancuronium. (A), Pentameric combination of zebrafish nAChR subunits. (B), Representative current traces of the ε-type (upper panels) and the δ-type (lower panels) elicited by 100 μM ACh in the presence of 0, 0.01, 0.1, 1 μM pancuronium, from left to right. Currents from the same oocytes are shown, respectively. Holding potential was -80 mV. Bars at the top of the traces indicate the timing of the 100 μM ACh application. (C), Dose-dependent inhibition of the ε-type and the δ-type. Data points are shown as mean ± sem. (N = 5 for the ε-type, N = 6 for the δ-type). (D), IC50s for the ε-type and the δ-type against pancuronium. Dots and bars indicate individual IC50 values and means, respectively. Error bars show standard errors. |
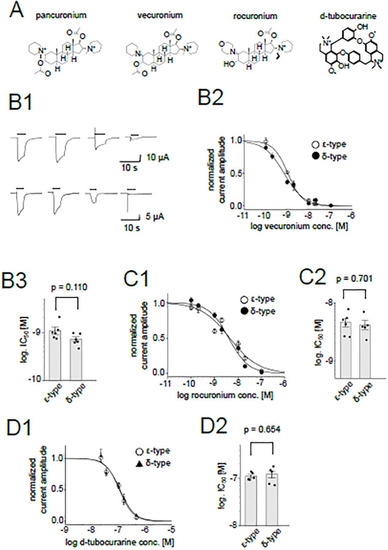
Inhibition of the nAChR by muscle relaxants. (A), Chemical structures of muscle relaxants. (B1), Representative current traces of the ε-type (upper panels) and the δ-type (lower panels) in the presence of 0, 0.1, 1, 10 nM vecuronium from left to right. Currents from the same oocytes are shown, respectively. Bars indicate the timing of the ACh application. (B2), Dose-dependent inhibition by vecuronium. Data points are shown as mean ± sem. (N = 6 for both the ε-type and δ-type). (B3), Comparison between IC50s of the ε-type and the δ-type for vecuronium. Dots and bars indicate the individual IC50 values and means, respectively. The error bars indicate SEM. (C1), (D1), Dose-dependent inhibition by rocuronium (C1) and d-tubocurarine (D1). Data are shown as mean ± sem. (N = 6 for the rocuronium inhibition of the ε-type, N = 5 for the rocuronium inhibition of the δ-type, N = 5 for the d-tubocurarine inhibition of the ε-type and N = 5 for the d-tubocurarine inhibition of the δ-type). (C2), (D2), Summary of IC50s of rocuronium and d-tubocurarine, respectively. Dots and bars are individual IC50 values and means, respectively. The error bars show SEM. |
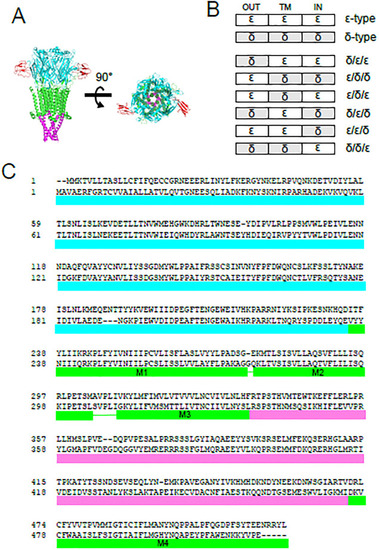
Chimeric subunits between the δ and the ε subunits. (A), 3D structure of nAChR. The extracellular domain, the transmembrane domain and the intracellular domain are shown in cyan, green and magenta, respectively. Two bungarotoxin (BTX) molecules, shown in red, bind to the extracellular domain (PDB ID; 6uwz) [ |
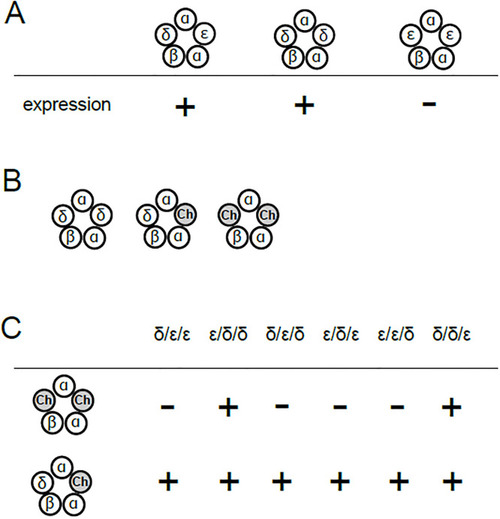
Pentameric combination of nAChR subunits and its expression in Xenopus oocytes. (A), nAChR containing the δ and the ε subunits (left) or two δ subunits (middle) are functional. In contrast, current was not recorded in oocytes co-injected with α, β and ε subunit cRNA, without δ (right). (B), Possible combination of subunits when co-injected with the α, β, δ and the chimeric subunit. “ch” represents the chimeric subunit. (C), Summary of functionality of receptors containing one or two chimeric subunits tested in this study. |
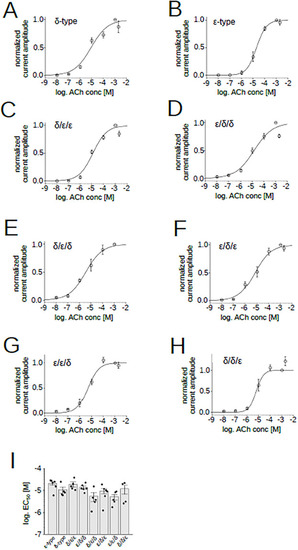
ACh dose–response relationships of the chimeric receptors. (A), (B), (C), (D), (E), (F), (G), (H), Dose dependency of ACh currents recorded from oocytes co-injected with α, β, δ and the chimeric subunit. Data points are shown as mean ± sem. Current amplitudes were normalized by the current elicited by 100 μM ACh. (I), EC50s of AChRs containing chimeric subunits. Points and bars indicate EC50 from individual oocytes and the means, respectively. Error bars indicate SEM (N = 6 for the ε-type, N = 5 for the δ-type, N = 5 for the δ/ε/ε, N = 5 for the ε/δ/δ, N = 5 for the δ/ε/δ, N = 6 for the ε/δ/ε, N = 5 for the ε/ε/δ, N = 6 for the δ/δ/ε). |
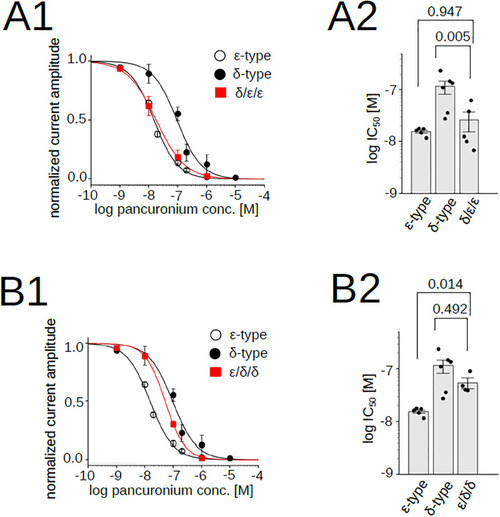
Pancuronium sensitivity of nAChR chimeras, δ/ε/ε and ε/δ/δ. (A1), (B1), Pancuronium dependent inhibition of nAChRs. Data for the δ- and the ε-types are identical to those shown in |
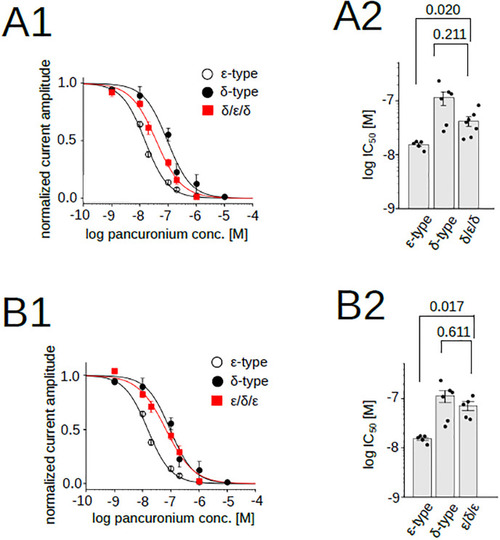
Pancuronium sensitivity of nAChR chimeras, δ/ε/δ and ε/δ/ε. (A1), (B1), Pancuronium dependent inhibition of nAChRs. Data for the δ- and the ε-types are identical to those shown in |
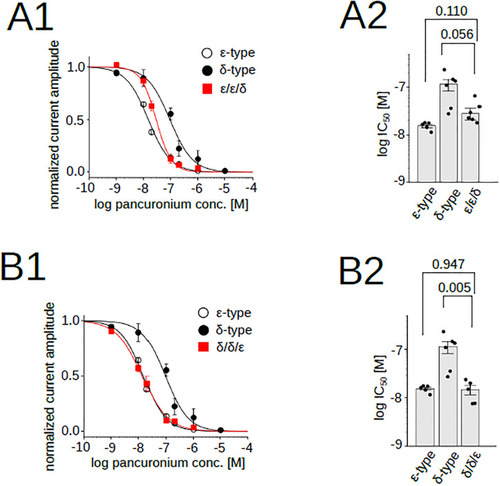
Pancuronium sensitivity of nAChR chimeras, ε/ε/δ and δ/δ/ε. (A1), (B1), Pancuronium dependent inhibition of nAChRs. Data for the δ- and the ε-types are identical to those shown in |
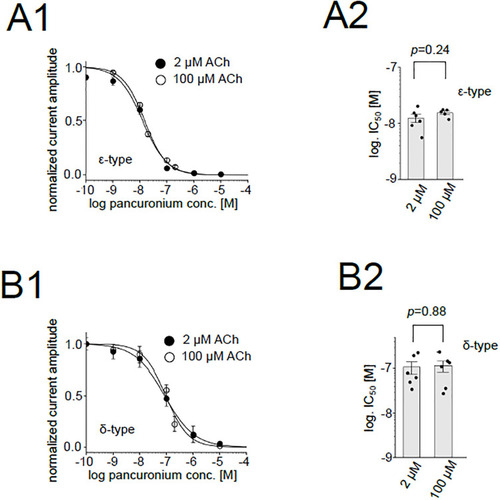
Inhibition of the ε-type and the δ-type receptors by pancuronium at 2 or 100 μM ACh. (A1), (B1), Dose-dependent inhibition of the ε-type (A1) and the δ-type (B1) at 2 or 100 μM ACh. Data are shown as mean ± sem. Data for 100 μM ACh are identical to those shown in |
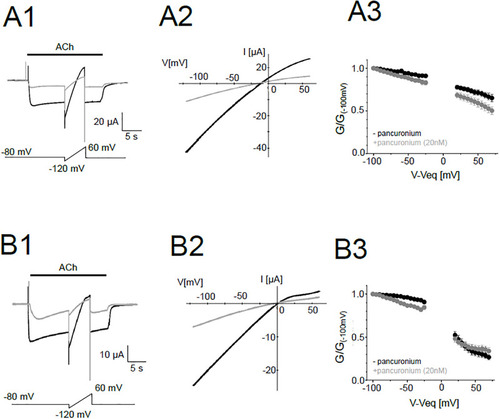
Voltage-dependent change of the conductance in the presence and absence of pancuronium. (A1), (B1), Representative current traces of the ε-type (A1) and the δ-type (B1). The black and gray traces are in the absence and the presence of 20 nM pancuronium, respectively. Pulse protocols are shown at the bottom. (A2), (B2), Representative I-V curves of the ε-type (A2) and the δ-type (B2). (A3), (B3), G-V curves of the ε-type (A3) and the δ-type (B3). Data were normalized by the conductance at -100 mV. Data are shown as mean ± sem. (N = 9 for all data). |