
|
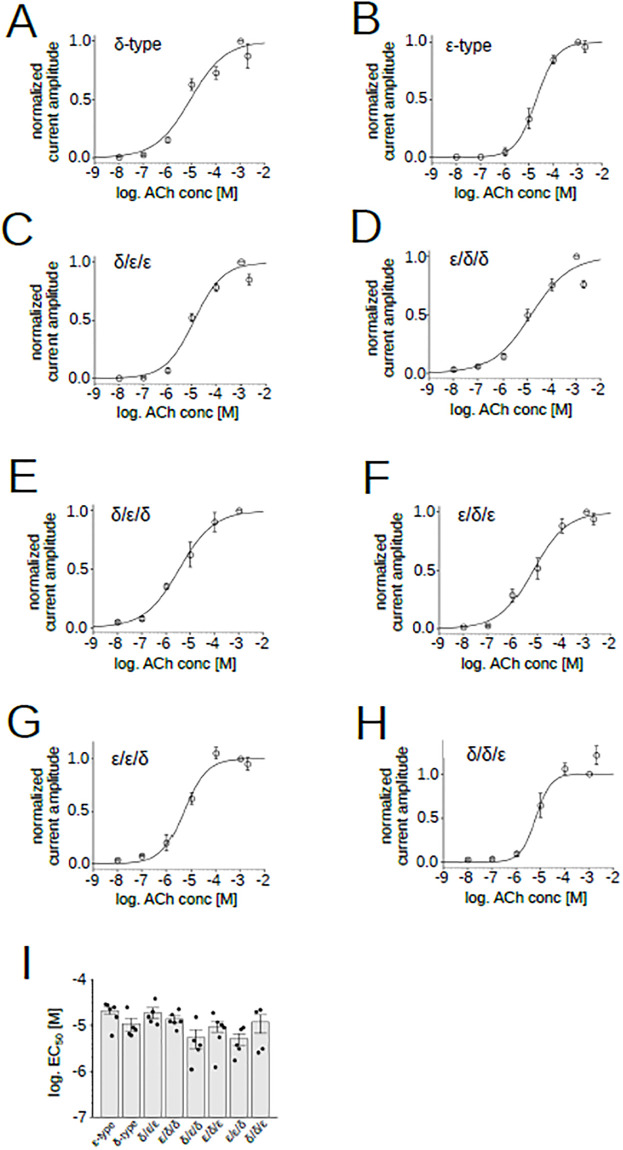
Fig 5 ACh dose–response relationships of the chimeric receptors.
(A), (B), (C), (D), (E), (F), (G), (H), Dose dependency of ACh currents recorded from oocytes co-injected with α, β, δ and the chimeric subunit. Data points are shown as mean ± sem. Current amplitudes were normalized by the current elicited by 100 μM ACh. (I), EC50s of AChRs containing chimeric subunits. Points and bars indicate EC50 from individual oocytes and the means, respectively. Error bars indicate SEM (N = 6 for the ε-type, N = 5 for the δ-type, N = 5 for the δ/ε/ε, N = 5 for the ε/δ/δ, N = 5 for the δ/ε/δ, N = 6 for the ε/δ/ε, N = 5 for the ε/ε/δ, N = 6 for the δ/δ/ε).