
Fig 2
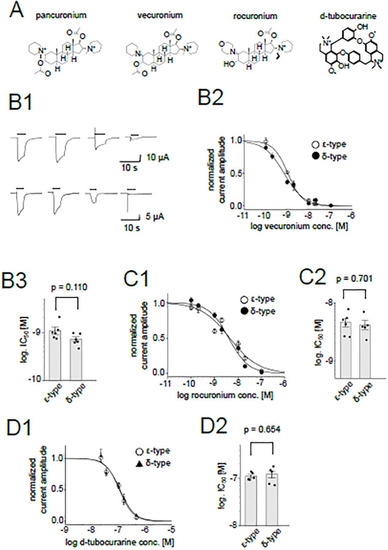
Inhibition of the nAChR by muscle relaxants. (A), Chemical structures of muscle relaxants. (B1), Representative current traces of the ε-type (upper panels) and the δ-type (lower panels) in the presence of 0, 0.1, 1, 10 nM vecuronium from left to right. Currents from the same oocytes are shown, respectively. Bars indicate the timing of the ACh application. (B2), Dose-dependent inhibition by vecuronium. Data points are shown as mean ± sem. (N = 6 for both the ε-type and δ-type). (B3), Comparison between IC50s of the ε-type and the δ-type for vecuronium. Dots and bars indicate the individual IC50 values and means, respectively. The error bars indicate SEM. (C1), (D1), Dose-dependent inhibition by rocuronium (C1) and d-tubocurarine (D1). Data are shown as mean ± sem. (N = 6 for the rocuronium inhibition of the ε-type, N = 5 for the rocuronium inhibition of the δ-type, N = 5 for the d-tubocurarine inhibition of the ε-type and N = 5 for the d-tubocurarine inhibition of the δ-type). (C2), (D2), Summary of IC50s of rocuronium and d-tubocurarine, respectively. Dots and bars are individual IC50 values and means, respectively. The error bars show SEM. |