
Image
|
Figure Caption
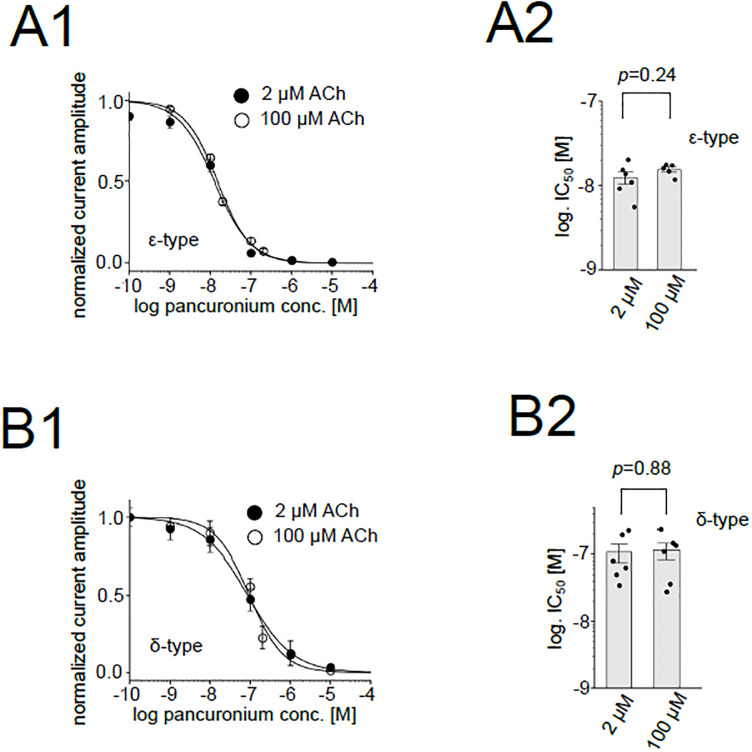
Fig 9 Inhibition of the ε-type and the δ-type receptors by pancuronium at 2 or 100 μM ACh.
(A1), (B1), Dose-dependent inhibition of the ε-type (A1) and the δ-type (B1) at 2 or 100 μM ACh. Data are shown as mean ± sem. Data for 100 μM ACh are identical to those shown in
Acknowledgments
This image is the copyrighted work of the attributed author or publisher, and
ZFIN has permission only to display this image to its users.
Additional permissions should be obtained from the applicable author or publisher of the image.
Full text @ PLoS One