
Image
|
Figure Caption
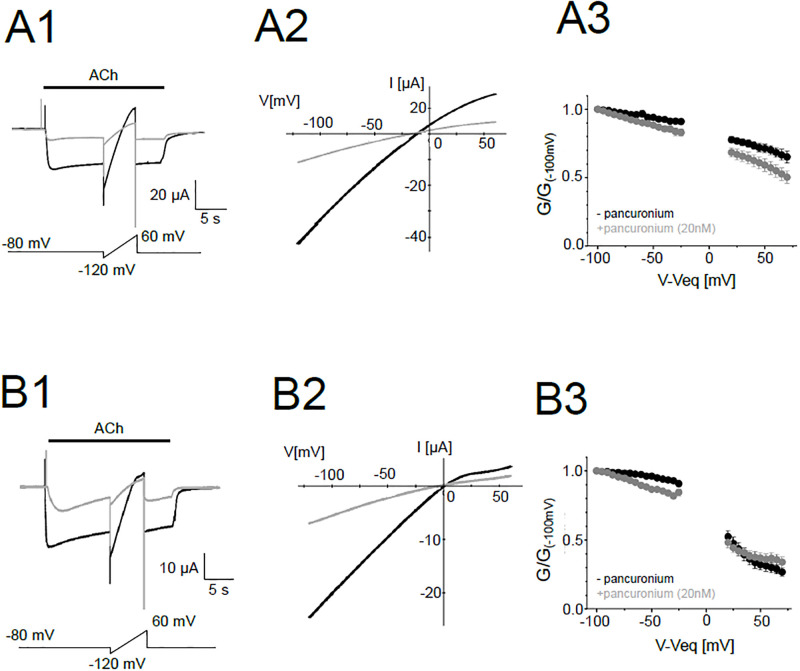
Fig 10 Voltage-dependent change of the conductance in the presence and absence of pancuronium.
(A1), (B1), Representative current traces of the ε-type (A1) and the δ-type (B1). The black and gray traces are in the absence and the presence of 20 nM pancuronium, respectively. Pulse protocols are shown at the bottom. (A2), (B2), Representative I-V curves of the ε-type (A2) and the δ-type (B2). (A3), (B3), G-V curves of the ε-type (A3) and the δ-type (B3). Data were normalized by the conductance at -100 mV. Data are shown as mean ± sem. (N = 9 for all data).
Acknowledgments
This image is the copyrighted work of the attributed author or publisher, and
ZFIN has permission only to display this image to its users.
Additional permissions should be obtained from the applicable author or publisher of the image.
Full text @ PLoS One