
- Title
-
Melanopsin elevates locomotor activity during the wake state of the diurnal zebrafish
- Authors
- Dekens, M.P.S., Fontinha, B.M., Gallach, M., Pflügler, S., Tessmar-Raible, K.
- Source
- Full text @ EMBO Rep.
melanopsin expression in the brain and knockout strategy
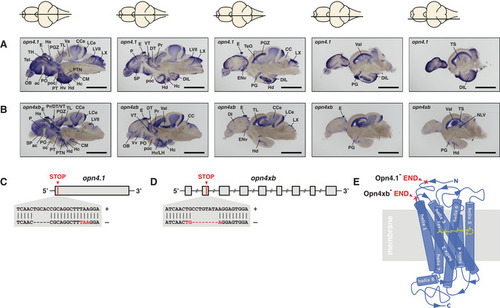
A, B In situs on adult brain sections reveal that (A) opn4.1 and (B) opn4xb are coexpressed in many brain domains including the epiphysis cerebri (indicated with E) or pineal. A horizontal line through a representation of the brain, above the section, indicates the location of the section within the brain. Scale bar: 1.0 mm. The brain domains in which the five melanopsins are expressed are presented in Fig EV1 and Table EV1. C The TALEN genome‐editing technique was applied for site‐directed mutagenesis. A 5 bp deletion was introduced proximal to the start codon of D An 8 bp deletion was introduced in the second exon (grey box) of the opn4xb gene resulting in a premature stop codon. E Model of the seven transmembrane G‐protein‐coupled photoreceptor shows the light absorbing molecule, the chromophore retinal (yellow), bound to helix 7 (blue). The red crosses indicate where the Melanopsins in the mutants are truncated: the mutated Opn4.1 has lost all transmembrane helices and the mutated Opn4xb ends after the second transmembrane helix. From the structure–function relationship of the photoreceptor, one can deduce that neither of the mutant Melanopsins is functional. |
Expression profiling reveals pathways downstream of Opn4
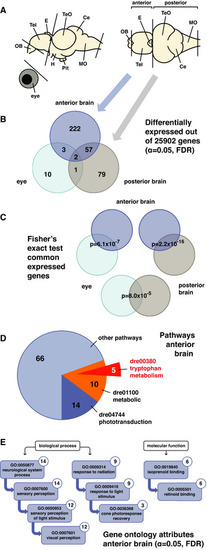
A Representation of the zebrafish adult brain shows the lateral and dorsal view with abbreviations for the following domains: olfactory bulb [OB], telencephalon [Tel], epiphysis cerebri or pineal [E], optic tectum [TeO], cerebellum [Ce], medulla oblongata [MO], hypothalamus [H] and hypophysis or pituitary [Pit]. Transcriptome sequencing was performed on cDNA from wild‐type and B Venn diagram shows the number of differentially expressed genes in the C Fisher's exact test shows that the shared differentially expressed genes between data sets are unlikely to be the result of coincidence. D Pie chart shows the number of differentially expressed genes in the E Ancestor charts show the gene ontology attributes to which the differentially expressed genes in the |
Melatonin pathway genes are overexpressed in the opn4 dko anterior brain
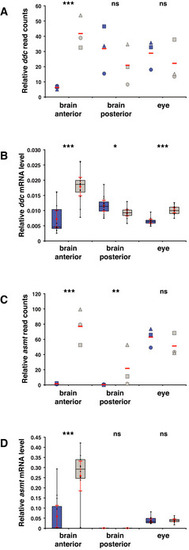
A Transcriptome sequencing reveals a significant higher number of B qPCR confirms a significant higher C Chart shows normalised read counts for asmt. A significant higher number of D qPCR confirms a significant higher Data information: In (A) and (C), blue markers indicate wild‐type, grey markers indicate |
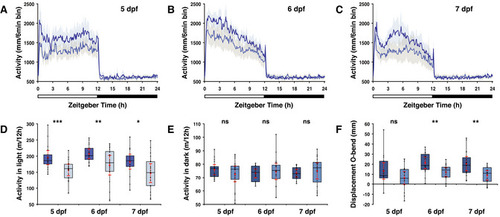
opn4 dko larvae display attenuated locomotor activity in the wake state.
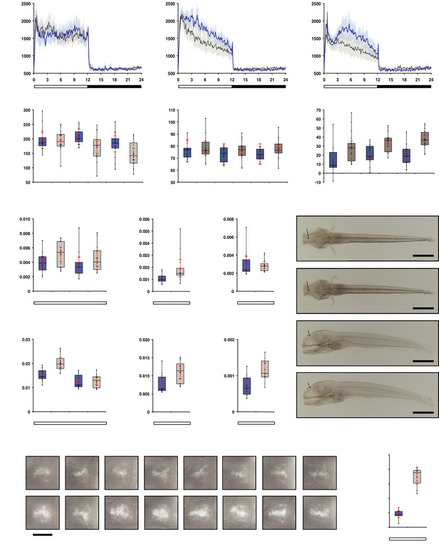
A-C Actograms show mean locomotor activity of wild‐type (blue line) and D Box plot shows reduced locomotor activity during the wake state in E Plot as in (D) for the rest state, shows no difference at 5 and 6 dpf and a significantly raised activity of the F opn4 dko larvae show significant more displacement in large‐angle turns at the onset of the dark interval than wild‐type on the 5th, 6th and 7th dpf (see also Fig EV3A–C G Plot shows asmt mRNA levels, detected by qPCR, in whole wild‐type (blue box) and whole opn4 dko (grey box) larvae at 6 dpf. H Plot shows a significant higher I Plot shows similar J ish with asmt probe on larvae sampled on the 6th dpf at ZT3 shows that asmt mRNA is confined to the pineal and indicates that the K Plot as in (G), shows significant higher levels of L Plot as in (H), shows significant higher levels of M Plot as in (I), shows significant higher levels of N ish with O Quantification of the adjusted intensity in the pineals from larvae presented in (N), implies a significant higher Data information: In (D–I), (K–M) and (O), boxplot divides the data in quartiles: the box indicates the interquartile range, with the horizontal line in the box denoting the median of the data set, the whiskers extend to the minimum and maximum, and meet the box at the median of the lower (quartile 1) and median of the upper (quartile 3) half of the dataset. Black dots indicate biological replicates (D–F: |
Larvae adapt their locomotor activity to the ambient light level
A–C Actograms show mean locomotor activity in wild‐type under a medium (dark blue line) and low (light blue line) intensity LD regime at (A) 5 dpf, (B) 6 dpf and (C) 7 dpf. Spectrum and photoperiod is the same under both conditions. The band on each side of the mean indicates the 95% confidence interval. The bar under the chart indicates the 12:12 h LD interval. D Box plot shows a significant reduction in locomotor activity during the wake state under a low (light blue box) than a medium (dark blue box) intensity LD regime on the 5th, 6th and 7th dpf. E As in (D) for the rest state (dark phase). No difference in locomotor activity was detected. F Larvae show significant less displacement in large‐angle turns at the onset of the dark interval under a low intensity LD regime than under a medium intensity LD regime on the 6th and 7th dpf (see also Fig Data information: In (D–F), boxplot divides the data in quartiles: the box indicates the interquartile range, with the horizontal line in the box denoting the median of the data set, the whiskers extend to the minimum and maximum, and meet the box at the median of the lower (quartile 1) and median of the upper (quartile 3) half of the dataset. Black dots indicate biological replicates ( |
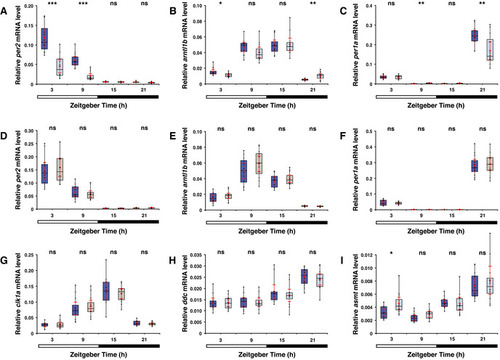
The light level is correlated with
A Per2 is known to act as an intermediary between the light detector and the melatonin synthesis pathway. Box plot shows B Box plot as in (A) shows mRNA levels of C Plot as in (A) shows mRNA levels of D Box plot shows similar E Box plot as in (D), shows similar F Box plot as in (D), shows similar G Box plot as in (D), shows similar H Box plot as in (A) shows I Box plot as in (A) shows Data information: boxplot divides the data in quartiles: the box indicates the interquartile range, with the horizontal line in the box denoting the median of the data set, the whiskers extend to the minimum and maximum, and meet the box at the median of the lower (quartile 1) and median of the upper (quartile 3) half of the dataset. Black dots indicate biological replicates ( |
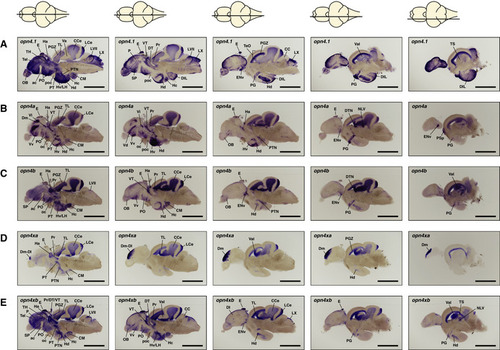
ishs on brain sections reveal broad expression of all five zebrafish (A–E) opn4.1 (A) opn4a (B) opn4b (C) opn4xa (D) and opn4xb (E). A horizontal line through a representation of the brain, above the section, indicates the location of the section within the brain. The names and abbreviations of all brain domains in which opn4 is expressed are listed in Table |
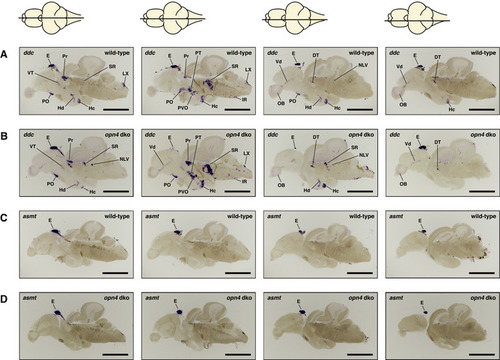
ish with ddc or asmt probe on opn4 dko mature brains show wild‐type expression patterns A, B Same ddc expression pattern was observed in wild‐type (A) and opn4 dko (B) brains (pineal lost from the brain slices in (B) centre panels). C, D asmt expression in wild‐type (C) and opn4 dko (D) adult brains show that asmt is not ectopically expressed. Thus, the higher asmt transcript level measured with qPCR in the opn4 dko anterior brain can be attributed to the pineal. Data information: The horizontal line through a representation of the brain, above the section, indicates the location of the section within the brain. Abbreviations: epiphysis cerebri (pineal) [E], caudal zone of periventricular hypothalamus [Hc], inferior raphe [IR], periventricular pretectum [Pr], preoptic area [PO], posterior tuberculum [PT], paraventricular organ [PVO], suprachiasmatic nucleus [SCN], superior raphe [SR]. Note that the duration of the colorimetric development of the ishs in this figure is not exactly the same. Scale bar: 1.0 mm. |
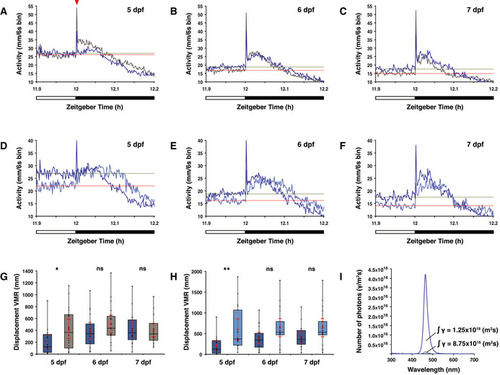
Overview of visual motor response (VMR) data A–C Actograms show the mean activity of wild‐type (dark blue line) and D–F Actogram shows mean activity of wild‐type larvae under a medium (dark blue line) or low (light blue line) intensity LD 12:12 h regime at the light to dark boundary on the (D) 5th dpf, (E) 6th dpf and (F) 7th dpf. Solely for estimation, the mean activity over the last 6 min in the light phase is plotted as a horizontal line for larvae under medium light intensity (green) and low light intensity (red). G opn4 dko larvae (grey box) show similar displacement in routine turns after transition from light to darkness as wild‐type (blue box) on the 6th and 7th dpf, but not on the 5th dpf ( H Wild‐type larvae show similar displacement in routine turns after transition from light to darkness under a low (light blue box) as under a medium (dark blue box) intensity LD regime on the 6th and 7th dpf, but not on the 5th dpf ( I Plot of the photon flux at medium (dark blue line) and low (light blue line) light intensities. For biological processes, the photon flux has a higher relevance than the irradiance (power of electromagnetic radiation) because a photoreceptor is activated by a photon. The photon flux is defined as the number of photons (γ) per unit area (m2/s). Data information: In (G) and (H), boxplot divides the data in quartiles: the box indicates the interquartile range, with the horizontal line in the box denoting the median of the data set, the whiskers extend to the minimum and maximum, and meet the box at the median of the lower (quartile 1) and median of the upper (quartile 3) half of the dataset. Black dots indicate biological replicates ( |
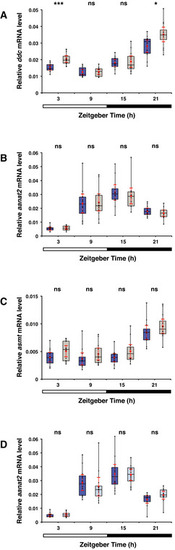
Expression of genes encoding melatonin synthesis enzymes on the 6th dpf A Box plot shows significant higher ddc mRNA levels measured by qPCR in whole opn4 dko larvae (grey box) at ZT3 and ZT21 (P = 0.0240) than in wild‐type (blue box). Bar under the chart indicates the 12:12 h LD interval. B As in (A) for the aanat2 mRNA level, shows no significant difference between wild‐type and opn4 dko whole lavae. C As in (A) for the asmt mRNA level, shows no significant difference between wild‐type and opn4 dko whole lavae. D Box plot shows aanat2 mRNA. The difference in mRNA levels between wild‐type larvae under a medium (dark blue box) or low (light blue box) intensity LD regime is not significant (ZT21: U‐test, P = 0.0684). Data information: boxplot divides the data in quartiles: the box indicates the interquartile range, with the horizontal line in the box denoting the median of the data set, the whiskers extend to the minimum and maximum, and meet the box at the median of the lower (quartile 1) and median of the upper (quartile 3) half of the dataset. Black dots indicate biological replicates (n = 12), the red dot indicates the mean, red error bars indicate the confidence interval (95%), asterisks indicate significance (0.001 < P(**) < 0.01, P(***) < 0.001, ns = not significant). |