IMAGE

Figure 3

ID
ZDB-IMAGE-220507-14
Genes
Source
Figures for Dekens et al., 2022
Image
Figure Caption

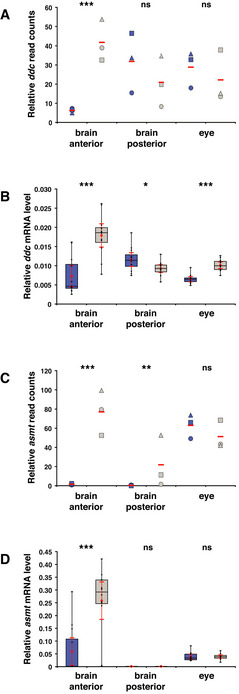
Figure 3 Melatonin pathway genes are overexpressed in the opn4 dko anterior brain

A  Transcriptome sequencing reveals a significant higher number of ddc reads in the opn4 dko than in the wild‐type anterior brain, and no difference in the posterior brain and eyes. ddc reads were normalised to 1,000 actb1 reads.

B   qPCR confirms a significant higher ddc transcript level in the opn4 dko (grey box) than in the wild‐type (blue box) anterior brain. In contrast to the transcriptome data, a significant higher level of ddc was detected by qPCR in the opn4 dko eyes. Quantification of the ddc mRNA level is relative to the actb1 mRNA measured in the sample.

C   Chart shows normalised read counts for asmt. A significant higher number of asmt reads is detected in the opn4 dko than in the wild‐type anterior brain. Note that asmt mRNA is detected in the posterior brain because the pineal stalk is most likely included in this part.

D   qPCR confirms a significant higher asmt transcript level in the opn4 dko than in the wild‐type anterior brain. Quantification of the asmt mRNA level is relative to the actb1 mRNA measured in the sample.

Data information: In (A) and (C), blue markers indicate wild‐type, grey markers indicate opn4 dko and red bar indicates mean. Biological replicates are indicated with round, triangular and square markers (n = 3). Asterisks indicate significance (0.01 < P(*) < 0.05, 0.001 < P(**) < 0.01, P(***) < 0.001, ns = not significant). In (B) and (D), boxplot divides the data in quartiles: the box indicates the interquartile range, with the horizontal line in the box denoting the median of the data set, the whiskers extend to the minimum and maximum, and meet the box at the median of the lower (quartile 1) and median of the upper (quartile 3) half of the dataset. Black dots indicate biological replicates (n = 12), the red dot indicates the mean and red error bars indicate the confidence interval (95%).

Figure Data
Acknowledgments
This image is the copyrighted work of the attributed author or publisher, and ZFIN has permission only to display this image to its users. Additional permissions should be obtained from the applicable author or publisher of the image. Full text @ EMBO Rep.