FIGURE

Figure 6

ID
ZDB-FIG-220507-21
Publication
Dekens et al., 2022 - Melanopsin elevates locomotor activity during the wake state of the diurnal zebrafish
Other Figures
All Figure Page
Back to All Figure Page
Figure 6

The light level is correlated with per2 and asmt transcript levels

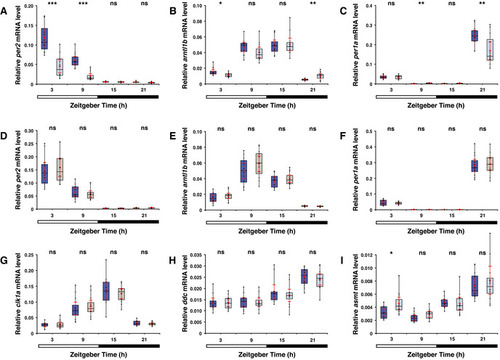
A   Per2 is known to act as an intermediary between the light detector and the melatonin synthesis pathway. Box plot shows per2 mRNA levels measured by qPCR in 6 dpf larvae placed under a low (light blue box) or medium intensity (dark blue box) LD regime. Under the low intensity light phase a significant reduction in the per2 transcript levels is detected. Bar under the chart indicates the 12:12 h LD interval.

B   Box plot as in (A) shows mRNA levels of arntl1b, which is in part regulated by per2. Under low intensity light a significant reduction in the arntl1b transcript level is detected at ZT3 and an increase at ZT21.

C   Plot as in (A) shows mRNA levels of per1a, which is regulated by the Arntl‐Clk heterodimer. Under low intensity light a significant reduction in the per1a transcript level is detected at ZT21 and an increase at ZT9.

D   Box plot shows similar per2 mRNA levels between wild‐type (blue box) and opn4 dko (grey box) under a medium intensity LD regime at 6th dpf.

E   Box plot as in (D), shows similar arntl1b mRNA levels.

F   Box plot as in (D), shows similar per1a mRNA levels.

G   Box plot as in (D), shows similar clk1a mRNA levels.

H   Box plot as in (A) shows ddc mRNA levels. Similar levels were detected between wild‐type larvae under a low or medium intensity LD regime.

I   Box plot as in (A) shows asmt mRNA levels. Under a low intensity LD regime a significant increase in the asmt transcript level is detected at ZT3.

Data information: boxplot divides the data in quartiles: the box indicates the interquartile range, with the horizontal line in the box denoting the median of the data set, the whiskers extend to the minimum and maximum, and meet the box at the median of the lower (quartile 1) and median of the upper (quartile 3) half of the dataset. Black dots indicate biological replicates (n = 12), the red dot indicates the mean, red error bars indicate the 95% confidence interval and asterisks indicate significance (0.01 < P(*) < 0.05, 0.001 < P(**) < 0.01, P(***) < 0.001, ns = not significant).

Expression Data
Genes:
Fish:
Condition:
Anatomical Term:
Stage: Day 6

Expression Detail
Antibody Labeling
Phenotype Data
Fish:
Condition:
Observed In:
Stage: Day 6

Phenotype Detail
Acknowledgments
This image is the copyrighted work of the attributed author or publisher, and ZFIN has permission only to display this image to its users. Additional permissions should be obtained from the applicable author or publisher of the image. Full text @ EMBO Rep.