
Figure EV4
- ID
- ZDB-FIG-220507-20
- Publication
- Dekens et al., 2022 - Melanopsin elevates locomotor activity during the wake state of the diurnal zebrafish
- Other Figures
- All Figure Page
- Back to All Figure Page
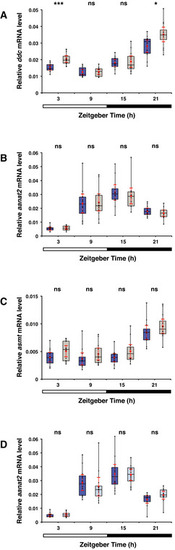
Expression of genes encoding melatonin synthesis enzymes on the 6th dpf A Box plot shows significant higher ddc mRNA levels measured by qPCR in whole opn4 dko larvae (grey box) at ZT3 and ZT21 (P = 0.0240) than in wild‐type (blue box). Bar under the chart indicates the 12:12 h LD interval. B As in (A) for the aanat2 mRNA level, shows no significant difference between wild‐type and opn4 dko whole lavae. C As in (A) for the asmt mRNA level, shows no significant difference between wild‐type and opn4 dko whole lavae. D Box plot shows aanat2 mRNA. The difference in mRNA levels between wild‐type larvae under a medium (dark blue box) or low (light blue box) intensity LD regime is not significant (ZT21: U‐test, P = 0.0684). Data information: boxplot divides the data in quartiles: the box indicates the interquartile range, with the horizontal line in the box denoting the median of the data set, the whiskers extend to the minimum and maximum, and meet the box at the median of the lower (quartile 1) and median of the upper (quartile 3) half of the dataset. Black dots indicate biological replicates (n = 12), the red dot indicates the mean, red error bars indicate the confidence interval (95%), asterisks indicate significance (0.001 < P(**) < 0.01, P(***) < 0.001, ns = not significant). |