
- Title
-
In vivo macromolecular crowding is differentially modulated by aquaporin 0 in zebrafish lens: Insights from a nanoenvironment sensor and spectral imaging
- Authors
- Vorontsova, I., Vallmitjana, A., Torrado, B., Schilling, T.F., Hall, J.E., Gratton, E., Malacrida, L.
- Source
- Full text @ Sci Adv
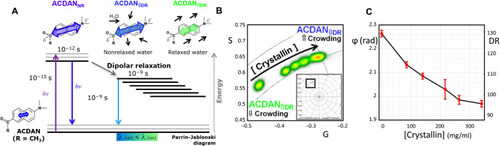
Solvatochromic properties of ACDAN measure water homeostasis and macromolecular crowding.
(A) ACDAN photophysics display strong sensitivity to the polarity of the environment and solvent relaxation. In an uncrowded environment, high DR results in a spectral red shift, while in crowded environments, low DR results in a spectral blue shift. (B) Phasor plot of spectral emission of ACDAN in solutions containing Antarctic tooth fish ɣM8d crystallin at concentrations of 0, 85, 140, 216, 264, and 340 mg/ml. A blue spectral shift is observed in response to increased macromolecular crowding. Inset shows complete spectral phasor space with region of interest marked with the black square. (C) The mean phasor phase angle/DR show an inverse relationship with crystallin concentration (n = 3). The DR scale was extended above 100 (right-hand vertical axes extends to 130) to include the spectral shift found at the crystallin solutions, while lens DR was in the 0 to 100 range. |
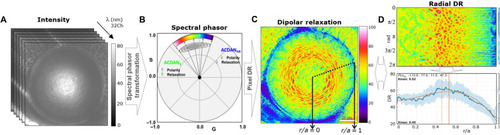
Characterization of lens ACDAN emission using the phasor approach.
(A) Hyperspectral images were transformed to the spectral phasor plot (B), which separates signal from relaxed and unrelaxed dipolar states. (C) DR values were applied back to the original image pixel by pixel, which were then processed for parameter extraction. (D) Radial analysis of mean DR signal from the center of the lens (r/a = 0), to lens periphery (r/a = 1) is shown, where r is the distance from lens center and a is the lens radius. The polar geometry is transformed to Cartesian geometry, with the horizontal direction being the radius and the vertical direction being the angle, and the mean DR value is then graphed (bottom), enabling analysis of regional change of mean DR. A polynomial fit was used to estimate max DR. Details can be found in fig. S2. |
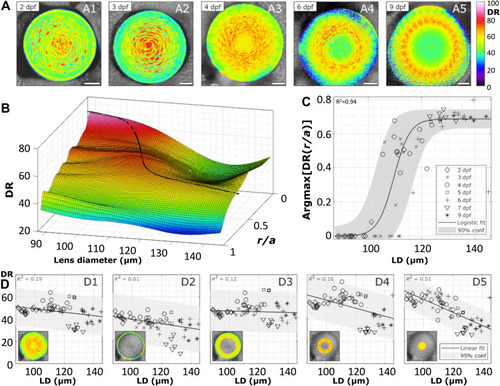
Distribution of DR in equatorial planes of zebrafish lenses during development.
(A) Examples of DR images of lenses at specified dpf. Scale bars, 20 μm. (B) Smoothed surface of the mean DR radial profile (r/a) as a function of lens diameter (LD) (n = 63), where r is the distance from lens center and a is the lens radius. (C) Radial lens position of the maximal DR value with development. The data are fit to a sigmoid and, in turn, represented on the surface in (B). (D) Mean DR of the whole equatorial lens plane (D1), the epithelium (D2), outer cortex (D3), inner cortex (D4), and nucleus (D5) of the lens as indicated by the insets. See table S2 for a summary of n numbers. See fig. S5 for ACDAN intensity images, spectral phasor plots, and DR images for examples shown in (A). |
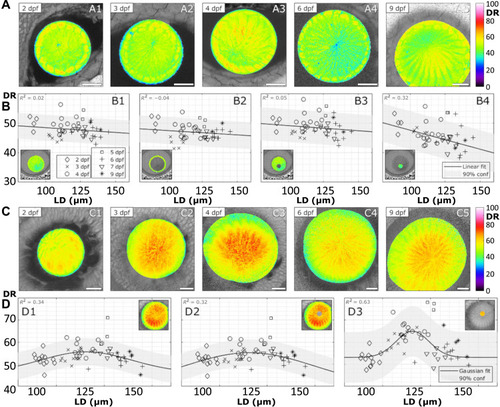
Distribution of DR in anterior and posterior planes of zebrafish lenses during development.
(A) Examples of DR images of lenses obtained at the anterior pole at specified dpf. Scale bars, 20 μm. (B) Mean DR of the whole anterior lens plane (B1), the epithelium (B2), fiber cells (B3), and sutural region (B4) as indicated by the insets (n = 45). (C) Examples of DR images of lenses obtained at the posterior pole at specified dpf. Scale bars, 20 μm. (D) Mean DR of the whole posterior lens plane (D1), fiber cells (D2), and sutural region (D3; n = 59). See table S2 for a summary of n numbers. |
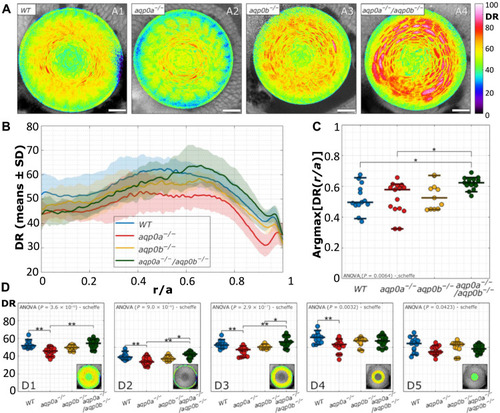
Disruption of DR distribution in Aqp0 mutant lenses.
(A) Examples of DR images of lenses at 4 dpf of WT and mutants. Scale bars, 20 μm. (B) DR radial profiles (n = 54). (C) Radial lens position of the maximal DR values are shown as function of distance into the lens, where r is the distance from lens center and a is the lens radius. (D) Mean DR of the whole equatorial lens plane (D1), epithelium (D2), outer cortex (D3), inner cortex (D4), and nucleus (D5) of the lens as indicated by the insets. See table S3 for a summary of n numbers. See fig. S8 for ACDAN intensity images, spectral phasor plots, and DR images for examples shown in (A). Statistical significance was denoted with * at a significance level P < 0.05 and ** at a significance level P < 0.005. |
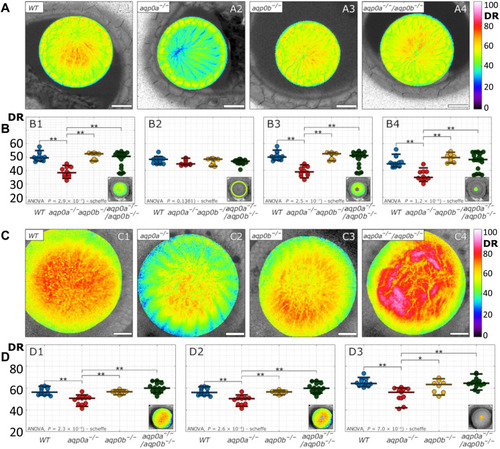
DR in anterior and posterior planes of Aqp0 mutant lenses.
(A) Examples of DR images were taken at anterior planes (10 μm from the anterior pole) of lenses at 4 dpf. Scale bars, 20 μm. (B) Mean DR of the whole anterior lens plane (B1), the epithelium (B2), fiber cells (B3), and sutural regions (B4) as indicated by the insets (n = 50). (C) Examples of DR images taken at posterior planes of lenses (75 to 85 μm from the anterior pole). Scale bars, 20 μm. (D) Mean DR of the whole posterior pole (D1), fiber cells (D2), and sutural region (D3) as indicated by the insets (n = 46). See table S3 for a summary of n numbers. Statistical significance was denoted with * at a significance level P < 0.05 and ** at a significance level P < 0.005. |
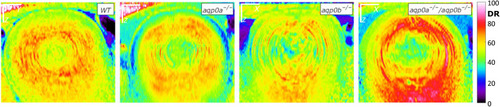
Axial orientation of DR signal in Aqp0 mutant lenses.
Examples of DR axial slices through the center of the lens in WT, aqp0a−/−, aqp0b−/−, and aqp0a−/−/aqp0b−/− double mutant lenses reconstructed from z-stacks. Anterior is oriented up. Scale bars, 20 μm. |
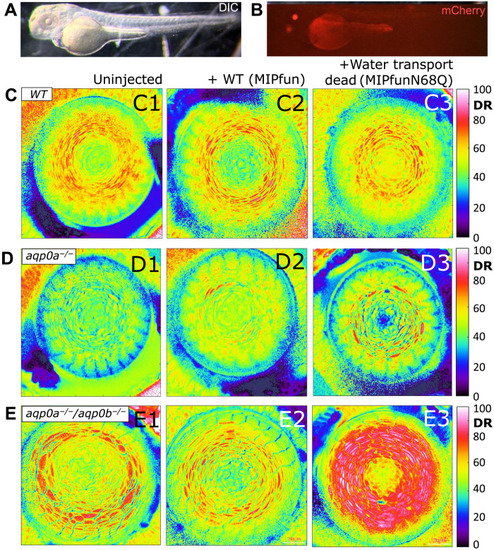
Water channel dead rescue did not restore water homeostasis in the lens.
(A) Example of a zebrafish injected with a rescue construct imaged under differential interference contrast (DIC) illumination and (B) strong expression of the transgenesis marker, mCherry, in the lens with some autofluorescence from the yolk. Examples of DR images of (C) WT, (D) aqp0a−/−, and (E) aqp0a−/−/aqp0b−/− double mutant 4 dpf lenses in equatorial orientation uninjected and injected with WT MIPfun (F. heteroclitus AQP0) rescue construct Tg(HuβB1cry:MIPfun-IRES-mCherry), and water transport dead construct Tg(HuβB1cry:MIPfunN68Q-IRES-mCherry). Representative lenses of at least four experiments are shown. |
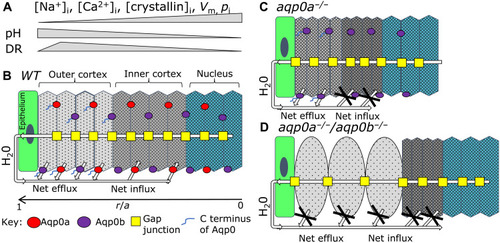
Model for the roles of Aqp0a and Aqp0b in lens water transport in vivo.
(A) Summary of physiological changes: intracellular Na+ ([Na+]i), Ca2+ ([Ca2+]i), crystallin concentrations ([crystallin]i), plasma membrane voltage potential (Vm), lens hydrostatic pressure (pi), and intracellular pH are shown as relative changes by gray bars, which occur from the outer cortex to the nucleus in a mature lens correlating to lens regions in (B). These changes determine its regional macromolecular crowding and, thus, DR. DR peaks in the outer cortex in mature lenses and decreases in the lens nucleus, indicating that the lowest macromolecular crowding and the highest water activity is in the outer lens cortex and lowest water activity is in the highly crowded lens nucleus. (B) Diagram of a mature equatorial lens fiber cell stack from epithelium (r/a = 1) to the center of the lens nucleus (r/a = 0) with direction of H20 flow shown on the basis of previously published work. (r is the distance from lens center and a is the lens radius). Aqp0a (red) and Aqp0b (purple) localize to both broad and narrow fiber cell membranes. Analysis of DR in aqp0a−/− (C) and aqp0a−/−/aqp0b−/− (D) lenses shows that both Aqp0a and Aqp0b facilitate osmotic water efflux in the outer cortex, while only Aqp0a facilitates water influx into fiber cells in the inner cortex (B). (C) Loss of Aqp0a results in a net loss of water influx, but Aqp0b is still able to facilitate efflux, resulting in net loss of water leading to increased macromolecular crowding and lower DR in the outer and inner cortex. (D) In double aqp0a−/−/aqp0b−/− mutants, both the H20 influx and efflux pathways are disrupted. This water loss results in a more crowded environment in the inner cortex with lower crowding in the swollen cells of the outer cortex. |