
Fig. 1
- ID
- ZDB-IMAGE-230226-40
- Publication
- Vorontsova et al., 2022 - In vivo macromolecular crowding is differentially modulated by aquaporin 0 in zebrafish lens: Insights from a nanoenvironment sensor and spectral imaging
- All Figures
- Figures for Vorontsova et al., 2022
|
Fig. 1
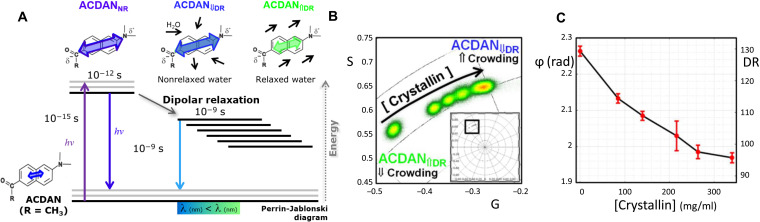
(A) ACDAN photophysics display strong sensitivity to the polarity of the environment and solvent relaxation. In an uncrowded environment, high DR results in a spectral red shift, while in crowded environments, low DR results in a spectral blue shift. (B) Phasor plot of spectral emission of ACDAN in solutions containing Antarctic tooth fish ɣM8d crystallin at concentrations of 0, 85, 140, 216, 264, and 340 mg/ml. A blue spectral shift is observed in response to increased macromolecular crowding. Inset shows complete spectral phasor space with region of interest marked with the black square. (C) The mean phasor phase angle/DR show an inverse relationship with crystallin concentration (n = 3). The DR scale was extended above 100 (right-hand vertical axes extends to 130) to include the spectral shift found at the crystallin solutions, while lens DR was in the 0 to 100 range.