
Fig. 3
- ID
- ZDB-FIG-230226-42
- Publication
- Vorontsova et al., 2022 - In vivo macromolecular crowding is differentially modulated by aquaporin 0 in zebrafish lens: Insights from a nanoenvironment sensor and spectral imaging
- Other Figures
- All Figure Page
- Back to All Figure Page
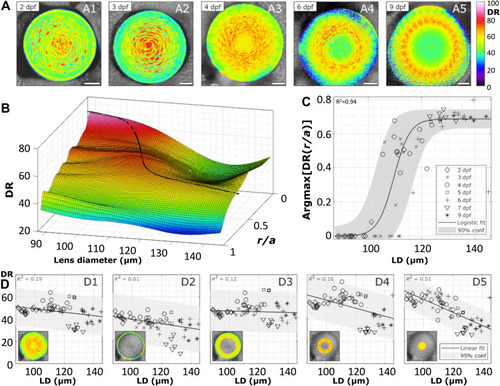
Distribution of DR in equatorial planes of zebrafish lenses during development.
(A) Examples of DR images of lenses at specified dpf. Scale bars, 20 μm. (B) Smoothed surface of the mean DR radial profile (r/a) as a function of lens diameter (LD) (n = 63), where r is the distance from lens center and a is the lens radius. (C) Radial lens position of the maximal DR value with development. The data are fit to a sigmoid and, in turn, represented on the surface in (B). (D) Mean DR of the whole equatorial lens plane (D1), the epithelium (D2), outer cortex (D3), inner cortex (D4), and nucleus (D5) of the lens as indicated by the insets. See table S2 for a summary of n numbers. See fig. S5 for ACDAN intensity images, spectral phasor plots, and DR images for examples shown in (A). |