
IMAGE
Fig. 4
- ID
- ZDB-IMAGE-230226-43
- Publication
- Vorontsova et al., 2022 - In vivo macromolecular crowding is differentially modulated by aquaporin 0 in zebrafish lens: Insights from a nanoenvironment sensor and spectral imaging
- All Figures
- Figures for Vorontsova et al., 2022
Image
|
Figure Caption
Fig. 4
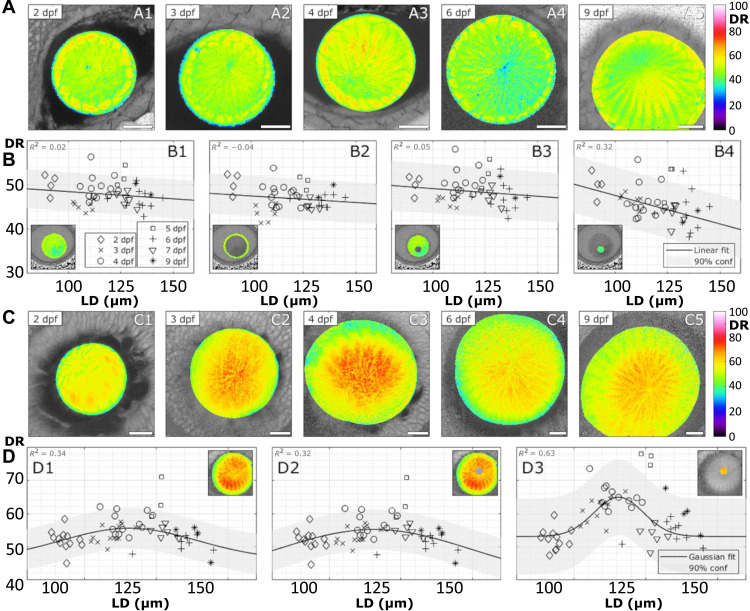
Distribution of DR in anterior and posterior planes of zebrafish lenses during development.
(A) Examples of DR images of lenses obtained at the anterior pole at specified dpf. Scale bars, 20 μm. (B) Mean DR of the whole anterior lens plane (B1), the epithelium (B2), fiber cells (B3), and sutural region (B4) as indicated by the insets (n = 45). (C) Examples of DR images of lenses obtained at the posterior pole at specified dpf. Scale bars, 20 μm. (D) Mean DR of the whole posterior lens plane (D1), fiber cells (D2), and sutural region (D3; n = 59). See table S2 for a summary of n numbers.
Acknowledgments
This image is the copyrighted work of the attributed author or publisher, and
ZFIN has permission only to display this image to its users.
Additional permissions should be obtained from the applicable author or publisher of the image.
Full text @ Sci Adv