
Fig. 2
- ID
- ZDB-IMAGE-230226-41
- Publication
- Vorontsova et al., 2022 - In vivo macromolecular crowding is differentially modulated by aquaporin 0 in zebrafish lens: Insights from a nanoenvironment sensor and spectral imaging
- All Figures
- Figures for Vorontsova et al., 2022
|
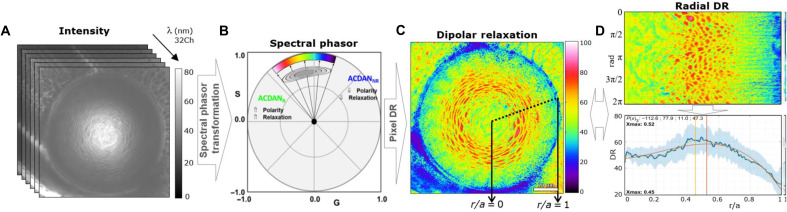
Fig. 2
(A) Hyperspectral images were transformed to the spectral phasor plot (B), which separates signal from relaxed and unrelaxed dipolar states. (C) DR values were applied back to the original image pixel by pixel, which were then processed for parameter extraction. (D) Radial analysis of mean DR signal from the center of the lens (r/a = 0), to lens periphery (r/a = 1) is shown, where r is the distance from lens center and a is the lens radius. The polar geometry is transformed to Cartesian geometry, with the horizontal direction being the radius and the vertical direction being the angle, and the mean DR value is then graphed (bottom), enabling analysis of regional change of mean DR. A polynomial fit was used to estimate max DR. Details can be found in fig. S2.