
|
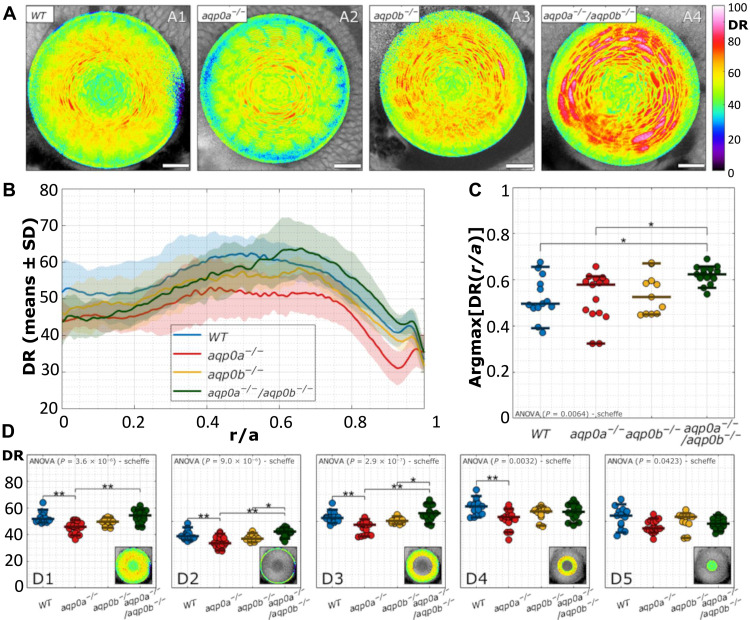
Fig. 5
(A) Examples of DR images of lenses at 4 dpf of WT and mutants. Scale bars, 20 μm. (B) DR radial profiles (n = 54). (C) Radial lens position of the maximal DR values are shown as function of distance into the lens, where r is the distance from lens center and a is the lens radius. (D) Mean DR of the whole equatorial lens plane (D1), epithelium (D2), outer cortex (D3), inner cortex (D4), and nucleus (D5) of the lens as indicated by the insets. See table S3 for a summary of n numbers. See fig. S8 for ACDAN intensity images, spectral phasor plots, and DR images for examples shown in (A). Statistical significance was denoted with * at a significance level P < 0.05 and ** at a significance level P < 0.005.