FIGURE SUMMARY
Title

Phenotypic analysis of catastrophic childhood epilepsy genes

Authors
Griffin, A., Carpenter, C., Liu, J., Paterno, R., Grone, B., Hamling, K., Moog, M., Dinday, M.T., Figueroa, F., Anvar, M., Ononuju, C., Qu, T., Baraban, S.C.
Source
Full text @ Commun Biol

The Epilepsy Zebrafish Project (EZP).

a Overview of the zebrafish epilepsy disease model discovery workflow from human genome-wide association studies (GWAS) to the generation of zebrafish models and phenotypic characterization. b Heatmap of homology scoring for all EZP zebrafish lines generated. Red circles indicate genes for which mutant zebrafish lines were previously published. c Tissue expression profiles of EZP zebrafish target genes. Heatmap represents the maximum number of sequence reads for each gene per tissue. d Developmental gene expression profiles for EZP lines. e Representative frame-shift mutant lines confirmed for depdc5 and eef1a2.

Electrophysiological screening of EZP lines.

a LFP recordings representing type 0 (low voltage, small, or no membrane fluctuations), type I (low amplitude, sharp interictal-like waveforms), and type II (low frequency, sharp ictal-like waveforms with large-amplitude multi-spike events and post-ictal slowing) scoring activity. For each example, a color-coded event rate histogram, full 15 min LFP recording, and high-resolution LFP close-up (red box, red trace a) are shown. b Heatmap showing mean larval zebrafish LFP recording scores for all 37 EZP zebrafish lines ranked from highest homozygote score to lowest; N = 77–127 larvae per gene (see https://zebrafishproject.ucsf.edu for N values on each individual line). A threshold of a mean LFP score >1.0 was classified as an EZP line exhibiting epilepsy (indicated in bold font: scn1lab, arxa, strada, stxbp1b, pnpo, gabrb3, eef1a2, and grin1b). c Regression plot for all 37 mutants showing mean LFP score versus % of Type II larvae for each homozygote. Seven homozygote and one heterozygote lines highlighted in “EZP-epi” box as clearly differentiated from a cluster of 31 non-epileptic EZP lines with LFP scores <1.0. Simple linear regression R2 = 0.8790; ***Significant deviation from zero, p < 0.0001; DFn, DFd = 1, 36. d Violin plots of all LFP scores recorded for EZP epilepsy lines (N = 190) compared with all WT control siblings (N = 783 larvae). Note: type 2 epileptiform events were only observed in 14.7% of all WT larvae. e Distribution of Type 0, I, and II scores for all WT, heterozygote, and homozygote larvae screened by LFP recordings (N = 3255 larvae).

Automated interictal-like event quantification.

a A representative LFP recording with interictal-like events. A voltage threshold (0.15–0.25 mV, depending on the noise level) was set for event detection. Data were binarized by threshold: super-threshold data points were scored as 1, and under-threshold data points were scored as 0. b A data binning method was used for automated quantification of interictal-like events: 0.01 s binning in 0.5 s time window. In each window, the value of the first bin was calculated, which is the ratio of active data points to the number of total data points within the window. c Color raster plots were created according to the raster score. A raster score threshold (0.2–0.4) was set to define the start and end of an event. d Comparison between interictal-like event durations measured automatically and manually. A 10 s representative epoch from each recording will be used as a testing sample to optimize the algorithm. Voltage and raster score thresholds were chosen when the difference between automated and manual results is <3% of manual measurements.

Electrographic seizure activity in epileptic zebrafish mutant lines.

a Schematic of recording configuration and protocol for electrophysiology-based screening of larval zebrafish. b Representative raw LFP-recording traces along with a corresponding wavelet time-frequency spectrogram and LFP scoring distribution plot for WT and mutant larvae are shown for each EZP epilepsy line. Type 0, I, and II scoring as in Fig. 2. A representative WT LFP recording with the corresponding wavelet time-frequency spectrogram is shown in Supplementary Figure 5. Scale bar = 500 µV. Representative LFP recordings and distribution plots for all 37 lines can be found online (https://zebrafishproject.ucsf.edu). c Cumulative plots of interictal event frequency and duration for all EZP epilepsy lines compared with WT sibling controls. Each point represents mean of all interictal events in a single 15 min larval LFP recording detected using custom software in MATLAB (N = 9775, WT; N = 6750, scn1lab; N = 2550, arxa; N = 5790, strada; N = 6750, stxbp1b; N = 3538, pnpo; N = 3455, gabrb3; N = 4335, eef1a2; N = 6610, grin1b*). d Cumulative plots of ictal event frequency and duration. Each point represents all ictal events in a single 15 min larval LFP recording (N = 56, WT; N = 62, scn1lab; N = 26, arxa; N = 26, strada; N = 48, stxbp1b; N = 22, pnpo; N = 59, gabrb3; N = 27, eef1a2; N = 55, grin1b*). *for grin1b designates heterozygote. **p < 0.01, ANOVA with Dunnett’s multiple comparisons test. Data displayed as mean ± SEM.

Distribution of ictal-like events.

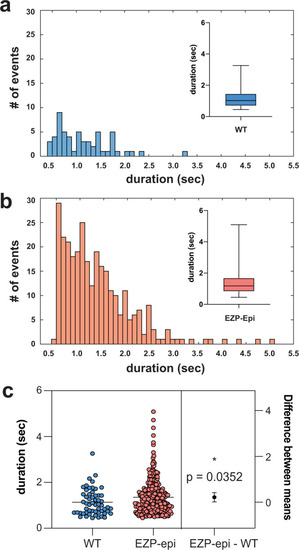
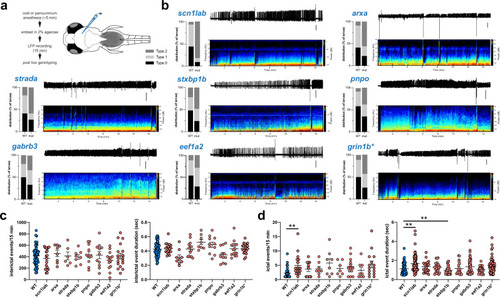
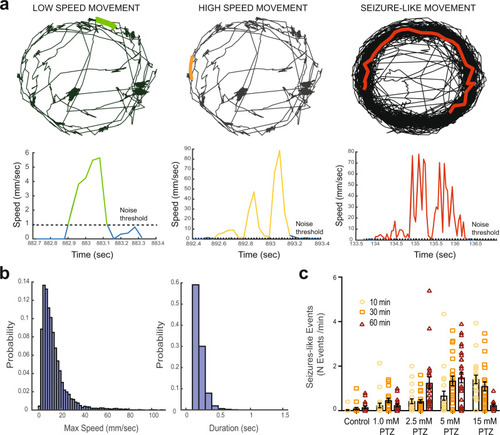
Histograms depict number and duration of ictal events measured using a custom MATLAB-based program for a all sibling wild-type (WT) larvae from EZP epilepsy lines and b same for epileptic zebrafish lines (EZP)-Epi. Box-and-whisker plots showing the distribution of ictal event durations; mean and minimum/maximum values are shown (insets). c Estimation plot showing that ictal event duration for WT (1.134 ± 0.075 s; N = 56 larvae) is shorter than for Epi-EZP (1.353 ± 0.043 s; N = 299 larvae); Non-parametric t test *p = 0.0352, t = 2.115, df = 353). Each dot on the top plot represents the duration (measured in msec) for one individual ictal event. LFP recording epochs were 15 min. Data displayed as mean ± SEM.

Survival and behavioral phenotypes.

a Heatmap displaying median wild-type (WT), heterozygote (HET), and homozygote mutant (MUT) larval survival for EZP lines. Range extends from 8 dpf (red) to 13 dpf (blue). Asterisks indicate MUTs with significant survival deficits compared WT control siblings; p < 0.05, log rank test. b Lines with significant survival deficits. c Quantification of the basal locomotor activity of epileptic lines after 1 hr habituation in DanioVision chamber. Maximum velocity and total distance traveled were extracted directly from EthoVision XT 11.5 software while the number of events ≥28 mm/s, termed high-speed events (HSE), and long duration HSE (≥ 1 s) were scored using a MATLAB algorithm (scn1lab552 WT N = 19 larvae, MUT N = 31 larvae; scn1lab WT N = 21 larvae, MUT N = 16 larvae; arxa WT N = 25 larvae, MUT N = 22 larvae; strada WT N = 27 larvae, MUT N = 31 larvae; stxbp1b WT N = 26 larvae, MUT N = 43 larvae; pnpo WT N = 42 larvae, MUT N = 40 larvae; gabrb3 WT N = 35 larvae, MUT N = 36 larvae; eef1a2 WT N = 30 larvae, MUT N = 27 larvae and grin1b WT N = 29 larvae and HET = 57 larvae). d Representative traces of arxa WT and MUT movement. e Comparison of duration of HSE in scn1lab ENU and CRISPR larvae. Data displayed as mean ± SEM, one-way ANOVA was used to determine the significance of both HET and MUT behavior for all lines (Supplementary Figure 4). Post hoc Dunnett multiple comparison test, *p ≤ 0.05, **p ≤ 0.005, **p < 0.0001.

Automated detection of behavioral seizure-like events.

a Example of low-speed movement in a WT larva (green), high-speed movement in the same WT larva (orange), and seizure-like movement in a PTZ-treated larva (red). Top traces represent the larvae track during 15 min recording in a 96-well plate. The bottom panels show speed values across time for the events highlighted. Note the short and long duration in the high-speed events in WT and PTZ-treated larvae, respectively. b Distribution of maximum speed and duration across all movements in WT (N = 109 larvae) during the 15-minute recording session. The average maximum speed was 10.5 mm/sec and the duration of the events was <1 s. c Frequency of seizure-like movements (defined as events with maximum speed >28 mm/sec and duration >1 s) in control and PTZ-treated larvae at different concentrations after 10, 30, and 60 minutes (two-way ANOVA p < 0.05). Note the increased number of events with increasing PTZ dose and the lower number when using 15 mM after 60 minutes owing to increased larvae mortality. Data displayed as mean ± SEM.

Developmental and pharmacological characterization.

a Representative images of dlx-GFP expressing interneurons in arxa MUT larvae (N = 8) and WT sibling larvae (N = 12) obtained from volumetric light-sheet imaging microscopy. Unpaired two-tailed t test *p = 0.0268; t = 2.411, df = 18). b High-resolution images of larvae were taken using a SteREO Discovery.V8 microscope (Zeiss) and overall head length, midbrain width, forebrain width and body length were quantified in eef1a2 MUT larvae (N = 6) and WT sibling larvae (N = 5). c Representative 1 hr LFP traces from gabrb3 MUT larvae exposed to AEDs. The first ∼10 min of the recording (in red) represents baseline. Drugs were bath applied at a concentration of 0.5 mM; N = 3–6 larvae per drug. Results from carbamazepine treatment shown as violin plot. Unpaired two-tailed t test **p < 0.0001; t = 6.344, df = 10). d Kaplan–Meier survival curves for aldh7a1 WT, aldh7a1 HET and aldh7a1 MUT larvae treatment with 10 mM pyrodixine (pyr) or vehicle for 30 mins daily starting at 4 dpf. Median survival for vehicle-treated aldh7a1 WT = 12 dpf (N = 12), aldh7a1 HET = 11.5 dpf (N = 22 larvae) and aldh7a1 MUT = 8 dpf (N = 9 larvae). Median survival for 10 mM pyridoxine (pyr) treated larvae for aldh7a1 WT = 12 dpf (N = 21 larvae), aldh7a1 HET = 12 dpf (N = 34 larvae) and aldh7a1 MUT = 12 dpf (N = 13 larvae). Data displayed as mean ± SEM.

Acknowledgments
This image is the copyrighted work of the attributed author or publisher, and ZFIN has permission only to display this image to its users. Additional permissions should be obtained from the applicable author or publisher of the image. Full text @ Commun Biol