FIGURE

Fig. 5

ID
ZDB-FIG-210611-33
Publication
Griffin et al., 2021 - Phenotypic analysis of catastrophic childhood epilepsy genes
Other Figures
All Figure Page
Back to All Figure Page
Fig. 5

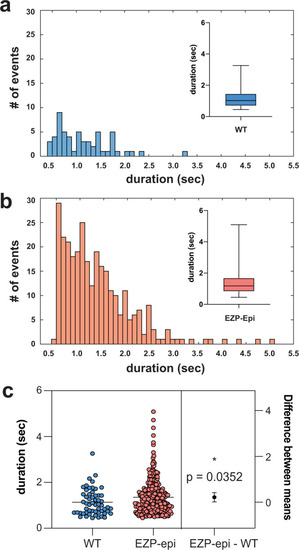
Distribution of ictal-like events.

Histograms depict number and duration of ictal events measured using a custom MATLAB-based program for a all sibling wild-type (WT) larvae from EZP epilepsy lines and b same for epileptic zebrafish lines (EZP)-Epi. Box-and-whisker plots showing the distribution of ictal event durations; mean and minimum/maximum values are shown (insets). c Estimation plot showing that ictal event duration for WT (1.134 ± 0.075 s; N = 56 larvae) is shorter than for Epi-EZP (1.353 ± 0.043 s; N = 299 larvae); Non-parametric t test *p = 0.0352, t = 2.115, df = 353). Each dot on the top plot represents the duration (measured in msec) for one individual ictal event. LFP recording epochs were 15 min. Data displayed as mean ± SEM.

Expression Data

Expression Detail
Antibody Labeling
Phenotype Data
Fish:
Observed In:
Stage: Day 5

Phenotype Detail
Acknowledgments
This image is the copyrighted work of the attributed author or publisher, and ZFIN has permission only to display this image to its users. Additional permissions should be obtained from the applicable author or publisher of the image. Full text @ Commun Biol